Posted inFeatured



Posted inMaterial Science
Processing of Plastics
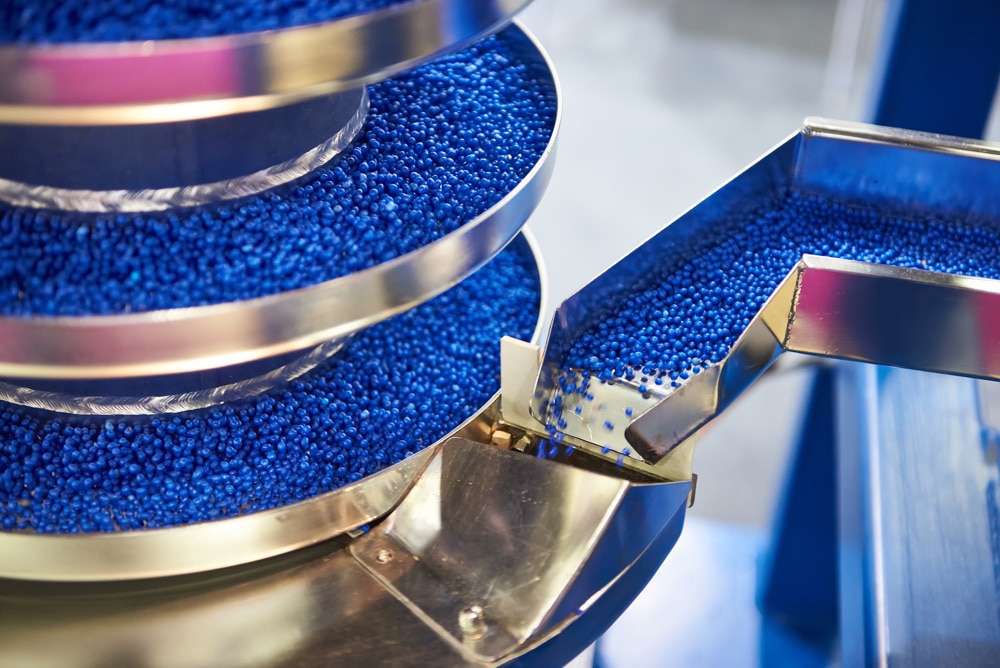
Injection moulding (United States Injection Molding) is a manufacturing technique for making parts from thermoplastic material. Molten plastic is injected at high pressure into a mold, which is the inverse of the desired shape. The mold is made by a moldmaker (or toolmaker) from metal, usually either steel or aluminium, and precision-machined to form the features of the desired part. Injection moulding is very widely used for manufacturing a variety of parts, from the smallest component to entire body panels of cars. It is the most common method of production, with some commonly made items including bottle caps and outdoor furniture. The most commonly used thermoplastic materials are polystyrene (low-cost, lacking the strength and longevity of other materials), ABS or acrylonitrile butadiene styrene (a co-polymer or mixture of compounds used for everything from Lego parts to electronics housings), nylon (chemically resistant, heat-resistant, tough and flexible - used for combs), polypropylene (tough and flexible - used for containers), polyethylene, and polyvinyl chloride or PVC (more common in extrusions as used for pipes, window frames, or as the insulation on wiring where it is rendered flexible by the inclusion of a high proportion of plasticiser). Compression molding is a method of molding in which the molding material, generally preheated, is first placed in an open, heated mold cavity. The mold is closed with a top force or plug member, pressure is applied to force the material into contact with all mold areas, and heat and pressure are maintained until the molding material has cured. The process employs thermosetting resins in a partially cured stage, either in the form of granules, putty-like masses,…