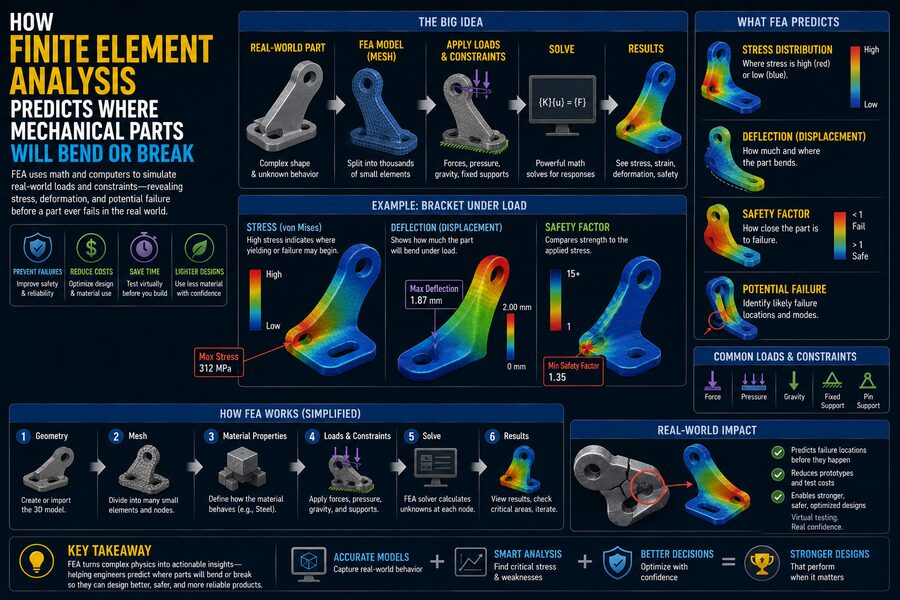

Before engineers manufacture a machine part, they often want answers to difficult questions:
Where will it bend?
Which region will experience the highest stress?
Will a bolt hole create a dangerous stress concentration?
Could the component permanently deform or fracture under load?
Building and destroying physical prototypes for every design variation would be slow and expensive. Instead, engineers often use a computational technique called Finite Element Analysis, or FEA. 💻⚙️
FEA allows engineers to create a digital representation of a mechanical component, divide it into many small regions, apply realistic forces and constraints, and calculate how the structure responds.
The result can reveal:
- Displacement
- Stress
- Strain
- Contact pressure
- Buckling tendencies
- Temperature effects
- Fatigue-critical locations
- Potential failure regions
FEA does not literally “see the future.” Instead, it applies mathematical models of material behavior and structural mechanics to approximate how a real component should respond under specified conditions.
When the model is built correctly, FEA can be an extraordinarily powerful engineering tool.
🧠 Why Engineers Divide a Part Into Small Pieces
Many real mechanical parts have complicated shapes.
Consider an automotive suspension bracket.
It may include:
- Curved surfaces
- Bolt holes
- Welds
- Ribs
- Thin sections
- Thick mounting regions
- Multiple load paths
Calculating the stress throughout such a shape using simple hand equations can be extremely difficult.
FEA solves this problem by dividing the geometry into many small pieces called finite elements.
This process is known as meshing. 🕸️
A simple mesh might look conceptually like:
Whole Mechanical Part
        ↓
Divided Into Small Elements
        ↓
Elements Connected at Nodes
        ↓
Mathematical Equations Solved
        ↓
Stress and Deformation Predicted
Each element has a relatively simple mathematical description.
By connecting thousands, millions, or sometimes even more elements together, software can approximate the behavior of a highly complicated structure.
📍 Nodes Connect the Elements
Finite elements meet at points called nodes.
The software calculates quantities such as displacement at these nodes.
From those displacements, it can determine related quantities such as:
- Strain
- Stress
- Reaction forces
Imagine a metal plate being pulled from both ends.
Some nodes move slightly.
The mathematical relationships between neighboring nodes tell the software how much individual elements stretch, compress, shear, or bend.
Combining those local calculations produces the overall deformation of the entire part. 📐
🏗️ The First Step Is Building the Geometry
An FEA analysis usually begins with a digital model.
The geometry may come from computer-aided design software, commonly called CAD.
For example, an engineer might import a 3D model of:
- A connecting rod
- Gear housing
- Aircraft bracket
- Robot arm
- Engine mount
- Pressure vessel component
However, the CAD model is not always used exactly as designed.
Tiny cosmetic features may dramatically increase computational cost without significantly affecting the engineering result.
Engineers may simplify features such as:
- Decorative grooves
- Logos
- Tiny chamfers
- Small holes that do not influence the load path
This process is often called geometry simplification or defeaturing.
The goal is to retain the features that matter structurally while avoiding unnecessary complexity. ✂️
🧱 The Material Model Tells FEA How the Part Behaves
The software also needs to know what the component is made from.
Material properties may include:
- Young’s modulus
- Poisson’s ratio
- Yield strength
- Ultimate tensile strength
- Density
- Thermal expansion coefficient
- Plastic stress-strain behavior
For a simple linear elastic analysis, two of the most important properties are Young’s modulus and Poisson’s ratio.
Young’s modulus describes how stiff the material is.
A material with a high Young’s modulus resists elastic deformation more strongly.
Steel, for example, is substantially stiffer than many polymers.
If an engineer assigns the wrong material properties, the resulting FEA predictions can also be wrong. ⚠️
🔩 Loads Represent Real-World Forces
Next, engineers define how the component is loaded.
Loads can include:
- Concentrated forces
- Distributed forces
- Pressure
- Torque
- Gravity
- Acceleration
- Bearing loads
- Thermal expansion
- Contact forces
Suppose engineers are analyzing a crane hook.
They may apply a downward load representing the suspended mass.
For a pressure vessel, they may apply internal pressure across the inside surface.
For a rotating disk, centrifugal loading may be important.
The quality of the results depends heavily on whether these loads realistically represent actual service conditions. 🎯
🔒 Boundary Conditions Tell the Model What Cannot Move
One of the most important parts of FEA is the definition of boundary conditions.
Boundary conditions represent how a component is supported, restrained, or connected to other objects.
For example, a bracket bolted firmly to a wall may be restrained at its mounting holes.
A simplified model might assume:
Mounting Holes → Fixed
External Surface → Load Applied
But real structures are often more complicated.
Bolts stretch.
Bearings rotate.
Welded connections deform.
Surfaces can slide against one another.
If an engineer makes a component artificially rigid at the wrong location, the analysis may produce unrealistic stress patterns.
This is one reason FEA requires engineering judgment rather than simply clicking a “solve” button. 🧠
📐 How FEA Predicts Bending
Suppose a cantilever beam is fixed at one end and loaded at the other.
FEA calculates how individual elements deform.
The elements near the fixed support experience significant bending.
The software combines the displacement of thousands of nodes and predicts the overall deflected shape.
The result may show:
- Maximum displacement at the free end
- Minimum displacement near the support
- Highest bending stress near the fixed region
Most FEA software can exaggerate the displayed deformation so engineers can easily see the bending pattern.
A component that actually bends only 0.2 mm may be displayed with a deformation magnification of 50 or 100 times.
This makes the shape easier to interpret, but engineers must check the actual numerical displacement rather than judging deformation only from the image. 📊
🌈 Why FEA Results Often Use Color Maps
FEA results are commonly displayed using colored contour plots.
For example:
Blue → Low stress
Green → Moderate stress
Yellow → Higher stress
Red → Highest stress
These images are visually powerful because engineers can immediately identify regions experiencing high stress or deformation.
However, the color red does not automatically mean the part will fail. 🚨
It simply represents the upper end of the plotted result range.
Engineers must compare the actual calculated stress with appropriate material limits and design criteria.
A red region representing 80 MPa could be perfectly acceptable for one material but unsafe for another.
⚙️ Stress Shows Internal Force Intensity
Stress describes how internal forces are distributed over an area.
A simple normal stress relationship is:
σ = F / A
where:
- σ = stress
- F = force
- A = cross-sectional area
Real components can experience more complicated stress states involving:
- Tension
- Compression
- Shear
- Bending
- Torsion
FEA calculates the stress components throughout the mesh.
Engineers then use appropriate failure criteria to determine whether the material can safely withstand them.
🔬 Strain Measures Deformation
Strain measures how much a material deforms relative to its original size.
A simple engineering strain relationship is:
ε = ΔL / L
where:
- ε = strain
- ΔL = change in length
- L = original length
For a linear elastic material:
σ = Eε
where E is Young’s modulus.
This is a form of Hooke’s law.
In an FEA model, the software often calculates displacements first, then derives strains and stresses from the deformation field.
🟥 Von Mises Stress Helps Evaluate Ductile Metals
Mechanical components often experience stress in several directions simultaneously.
For ductile metals such as many steels and aluminum alloys, engineers frequently examine von Mises stress.
Von Mises stress combines a three-dimensional stress state into a single equivalent value.
Engineers can then compare that equivalent stress with the material’s yield strength.
Suppose:
Yield strength = 300 MPa
and:
Maximum von Mises stress = 150 MPa
A simplified static comparison would suggest the part remains below first yield under the modeled loading.
A basic factor of safety might be calculated as:
Factor of Safety = Yield Strength / Working Stress
Therefore:
300 / 150 = 2.0
However, real design decisions may require additional factors for uncertainty, fatigue, temperature, manufacturing quality, codes, and other effects. 🛡️
💥 Brittle Materials Require Different Failure Criteria
Von Mises stress is not appropriate for every material.
Brittle materials behave differently from ductile metals.
Examples can include:
- Certain cast irons
- Ceramics
- Glass
- Some composites
For these materials, engineers may consider maximum principal stress or specialized failure criteria.
Composite materials may require even more complex approaches because their strength depends strongly on fiber direction.
The correct failure criterion depends on the actual material physics.
FEA software can calculate many types of stress values, but the engineer must know which result is meaningful. 🔍
🕳️ FEA Is Excellent at Finding Stress Concentrations
Mechanical parts often fail near geometric discontinuities.
Common stress-concentration locations include:
- Holes
- Sharp corners
- Threads
- Keyways
- Grooves
- Notches
- Sudden thickness changes
Imagine a flat metal plate containing a circular hole.
Far from the hole, stress may be relatively uniform.
Near the edge of the hole, however, the stress becomes significantly higher.
FEA can reveal this concentration clearly.
Engineers may then redesign the area by:
- Increasing the radius
- Increasing local thickness
- Moving the hole
- Adding reinforcement
- Changing the load path
This is one of the most valuable uses of FEA during product development. 🔧
🔄 Fillets Can Reduce Peak Stress
Sharp inside corners are especially problematic because they create high stress concentrations.
Adding a fillet, or rounded corner, spreads the load over a smoother geometric transition.
An FEA comparison may show:
Sharp corner → high localized stress
versus:
Rounded fillet → lower peak stress
Engineers can experiment with different fillet radii digitally before manufacturing anything.
This allows design optimization to happen rapidly and inexpensively. 📉
🕸️ Mesh Density Strongly Affects Accuracy
A coarse mesh uses relatively large elements.
A fine mesh uses smaller elements.
Smaller elements can represent complex stress variations more accurately, especially near:
- Holes
- Fillets
- Contacts
- Notches
- Load application regions
However, finer meshes require more computational resources.
The challenge is finding the right balance.
An engineer might use:
Coarse mesh in simple low-stress regions
and:
Fine mesh near critical features
This is known as local mesh refinement.
It improves accuracy without making the entire model unnecessarily expensive to solve. 💻
📈 Engineers Perform Mesh-Convergence Studies
How does an engineer know whether the mesh is fine enough?
One important technique is a mesh-convergence study.
The engineer may solve the same model several times:
Mesh 1 → 20,000 elements
Mesh 2 → 80,000 elements
Mesh 3 → 250,000 elements
Mesh 4 → 600,000 elements
Suppose the predicted displacement is:
Mesh 1 → 2.31 mm
Mesh 2 → 2.18 mm
Mesh 3 → 2.15 mm
Mesh 4 → 2.14 mm
The results are converging toward a stable value.
That gives greater confidence in the numerical solution.
Simply creating an extremely fine mesh without checking convergence is not always the best approach. ✅
⚠️ Stress Singularities Can Mislead Engineers
Sometimes FEA predicts extremely high stresses at mathematically idealized points.
For example:
- A perfectly sharp re-entrant corner
- A point load
- A perfectly rigid constraint
As the mesh becomes finer, the calculated stress at that location may continue increasing instead of converging.
This is called a stress singularity.
It does not necessarily mean the real component experiences infinite stress.
Real materials have finite radii, distributed contact areas, local plasticity, and manufacturing imperfections.
Engineers learn to distinguish physically meaningful stress concentrations from mathematical artifacts. 🧠
🔩 Contact Analysis Makes Models More Realistic
Many mechanical assemblies contain parts that touch one another.
Examples include:
- Bolted joints
- Bearings
- Gears
- Press fits
- Mechanical clamps
Contact can be difficult to model because surfaces may:
- Separate
- Slide
- Stick
- Transfer compression
- Experience friction
A simple linear model may assume parts are perfectly bonded.
More realistic analysis can define actual contact behavior.
This makes the model more computationally demanding but can produce much better predictions for assemblies. ⚙️
🔧 Bolts Can Be Modeled in Different Ways
Bolted joints illustrate the tradeoff between accuracy and computational complexity.
An engineer might represent a bolt as:
- A simple connector
- A beam element
- A pretensioned bolt model
- A complete threaded 3D geometry
Modeling every thread explicitly may be unnecessary for a large structural assembly.
But if thread-root stress is the primary concern, a detailed model might be justified.
FEA engineers therefore choose the level of detail appropriate to the question being asked. 🎯
📉 Linear FEA Works Only Within Certain Assumptions
A basic structural FEA is often linear.
Linear analysis typically assumes:
- Small deformation
- Linear elastic material behavior
- Unchanging boundary conditions
- Relatively simple contact conditions
This is computationally efficient.
But real structures may behave nonlinearly.
Examples include:
- Large bending
- Material yielding
- Rubber deformation
- Contact opening and closing
- Buckling
These situations require nonlinear FEA.
🔥 Plasticity Predicts Permanent Deformation
If stress exceeds a ductile material’s yield strength, the material may deform permanently.
Linear elastic FEA cannot accurately describe this behavior beyond yield.
A nonlinear material model can represent plasticity.
The software may use a stress-strain curve obtained from physical testing.
This allows the model to estimate:
- Where yielding starts
- How the plastic region spreads
- Whether deformation becomes excessive
- Whether the structure can redistribute load
This can be extremely important in crash analysis, metal forming, pressure vessels, and overload studies. 🚗
🌀 Buckling Requires Stability Analysis
A slender component may fail without the material reaching its ordinary strength limit.
For example, a thin column under compression can suddenly bend sideways.
This is buckling.
FEA can estimate buckling modes and critical loads.
A linear eigenvalue buckling analysis can identify likely instability shapes.
More realistic nonlinear buckling studies may also include:
- Initial geometric imperfections
- Material plasticity
- Contact
- Large deformation
This helps engineers evaluate whether thin or slender structures remain stable under compression. 🏗️
🔁 Fatigue Is About Repeated Loading
Many mechanical parts do not fail because of one enormous load.
Instead, they experience millions of smaller load cycles.
Examples include:
- Crankshafts
- Suspension components
- Aircraft structures
- Rotating shafts
- Gear teeth
Repeated stress can create fatigue cracks even when the peak stress is below the material’s yield strength.
Engineers can use FEA to identify stress ranges in critical regions.
Those stresses can then be combined with fatigue data such as:
- S-N curves
- Mean stress corrections
- Load spectra
This allows engineers to estimate which locations are most likely to experience fatigue damage. 🔄
🌡️ Temperature Can Change Mechanical Stress
Mechanical components often operate at elevated or uneven temperatures.
A hot engine component expands.
If that expansion is restricted, thermal stresses can develop.
FEA can combine thermal and structural analysis.
A typical process is:
Calculate temperature distribution → Calculate thermal expansion → Calculate resulting stress
This is important for:
- Engines
- Turbines
- Exhaust systems
- Electronics
- Brakes
- Industrial furnaces
A component may therefore fail from a combination of mechanical loading and thermal stress rather than either effect alone. 🔥
🧪 FEA Does Not Replace Physical Testing
FEA is extremely useful, but it is still a model.
Every model contains assumptions.
Errors may come from:
- Incorrect loads
- Wrong material data
- Unrealistic constraints
- Poor mesh quality
- Simplified geometry
- Incorrect contact definitions
For important designs, engineers validate the model using physical testing.
They may attach strain gauges to a prototype and compare measured strains with FEA predictions.
If test and simulation results agree reasonably well, confidence in the model increases.
FEA and physical testing are therefore complementary rather than competing methods. 🔬
📏 Hand Calculations Still Matter
Engineers also compare FEA results with simple analytical calculations whenever possible.
Suppose FEA predicts that a simple beam deflects 0.1 mm.
A hand calculation predicts 10 mm.
That large difference suggests something may be wrong with the model.
Perhaps the wrong units were used.
Perhaps the beam was overconstrained.
Perhaps the load was entered incorrectly.
Basic engineering calculations provide an important sanity check.
Advanced software does not eliminate the need to understand mechanics. 📚
🏎️ FEA Helps Engineers Optimize Weight
FEA is particularly valuable when designers want a component that is both strong and lightweight.
Suppose a bracket contains a large region with extremely low stress.
That material may not be contributing much structurally.
Engineers might remove some of it.
Then they rerun the analysis.
This iterative process can lead to:
- Thinner walls
- Strategic ribs
- Hollow sections
- Larger fillets
- Better load paths
Modern optimization methods can automate parts of this process.
One example is topology optimization, where software identifies where material is most structurally useful.
The resulting shapes can appear organic and are increasingly practical with additive manufacturing. 🪶
🏭 FEA Reduces Expensive Prototype Iterations
Imagine a company developing a new gearbox housing.
Without simulation, the process might be:
Build prototype → Test → Discover weakness → Redesign → Manufacture again
Each iteration costs time and money.
With FEA:
Build model → Simulate → Identify weakness → Modify CAD → Simulate again → Manufacture improved prototype
Physical testing is still necessary, but fewer unsuccessful prototypes may be required.
This can shorten development schedules and reduce engineering cost. 💰
🚗 Where FEA Is Used
Finite Element Analysis is applied across many industries.
🚘 Automotive Engineering
Used for:
- Chassis structures
- Suspension parts
- Engine components
- Crash structures
- Wheels
✈️ Aerospace
Used for:
- Wings
- Fuselage structures
- Turbine components
- Landing gear
🏭 Industrial Machinery
Used for:
- Frames
- Shafts
- Gearboxes
- Pressure equipment
🤖 Robotics
Used for:
- Robot arms
- Joint housings
- Lightweight frames
🏗️ Civil and Structural Engineering
Used for:
- Bridges
- Building components
- Connections
- Foundations
🩺 Biomedical Engineering
Used for:
- Implants
- Prosthetic components
- Medical devices
The same underlying finite-element principles can be adapted to a remarkable range of engineering problems.
🚨 A Beautiful FEA Plot Can Still Be Wrong
Modern simulation software can generate impressive images.
A colorful stress contour may look extremely scientific.
But attractive graphics do not guarantee correct physics.
A model with unrealistic boundary conditions can produce very precise-looking but completely misleading numbers.
Engineers therefore ask questions such as:
- Does the deformed shape make physical sense?
- Are reaction forces balanced?
- Is the load path realistic?
- Has mesh convergence been checked?
- Do the results agree with hand calculations?
- Are material properties appropriate?
- Are peak stresses physically meaningful?
This critical interpretation is one of the most important parts of FEA. 🧐
🎯 How Engineers Decide Whether a Part Will Break
There is rarely one universal number called “breaking stress.”
Engineers compare the FEA results with appropriate failure mechanisms.
They may examine:
Yielding
Will a ductile metal permanently deform?
Brittle fracture
Could principal stress exceed brittle material strength?
Fatigue
Will repeated loading create cracks?
Buckling
Could the structure become unstable?
Excessive deformation
Will the part bend too much even without breaking?
Contact failure
Will local pressure damage mating surfaces?
Creep
Will long-term high-temperature loading cause gradual deformation?
Therefore, predicting failure requires understanding how the particular component is likely to fail, not simply locating the highest stress color on the screen.
🎯 Final Takeaway
Finite Element Analysis predicts how mechanical parts bend or fail by turning complex geometry into a network of small mathematical elements.
Engineers assign materials, apply realistic loads, define supports and contacts, and let the solver calculate how the interconnected elements deform. From those displacements, the software derives stresses and strains throughout the component. 💻⚙️
The resulting maps can reveal:
- High-stress regions
- Excessive deflection
- Stress concentrations
- Potential yielding
- Fatigue-sensitive locations
- Buckling modes
- Thermal distortion
But FEA is not automatic truth.
Its accuracy depends on the quality of the mesh, material data, loading assumptions, boundary conditions, contact models, and engineering interpretation.
The most reliable engineers do not simply ask:
“What does the software say?”
They ask:
“Does this result make physical sense, and can I verify it?”
When combined with hand calculations, material knowledge, physical testing, and sound engineering judgment, FEA becomes one of the most powerful tools available for designing mechanical parts that are lighter, stronger, safer, and more reliable. 🧩🔩📊