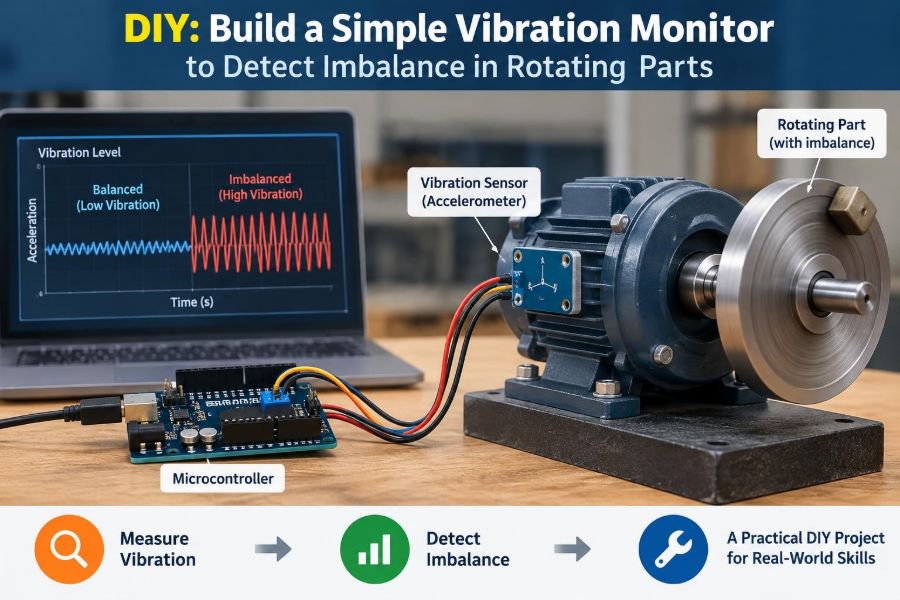

A small fan that suddenly walks across a bench, a washing machine that shakes during spin, or a motor that develops a low, persistent hum can seem like ordinary annoyances. Often, though, those motions are the first visible clues that something rotating is no longer behaving symmetrically.
In a workshop, imbalance can shorten bearing life, loosen fasteners, fatigue brackets, and degrade product quality. In a classroom, it offers a direct way to see how mass distribution, speed, stiffness, and measurement all interact in a real mechanical system.
You do not need an industrial condition-monitoring system to begin exploring the problem. A modest sensor, a microcontroller or data-logging device, and a carefully mounted test setup can reveal vibration patterns that your hand alone cannot reliably distinguish.
This project builds a simple vibration monitor for comparison and early fault indication, not for certifying a machine as safe. The goal is to learn what a healthy baseline looks like, recognize a change, and make a sensible decision about inspection or balancing.
🔄 What rotating imbalance means
A rotating part is imbalanced when its mass is not distributed evenly around its intended axis of rotation. Its center of mass then sits slightly away from that axis, so rotation produces a repeating outward force.
A wheel with a small heavy spot is the familiar example. At rest, that extra mass may seem insignificant; at speed, it continually pulls outward in a changing direction, exciting the shaft, bearings, housing, and supporting structure.
The basic relationship is often expressed as F = m × r × ω², where m is the unbalanced mass, r is its distance from the axis, and ω is angular speed. The square of speed is the key practical lesson: a modest imbalance can become much more noticeable as rpm rises.
📳 Why vibration is a useful early signal
Vibration is mechanical motion around an equilibrium position. Sensors convert that motion into an electrical signal that can be displayed, logged, and compared over time.
Imbalance commonly creates vibration at the machine’s rotational frequency, often called 1× running speed. A shaft turning at 30 revolutions per second tends to produce a strong component near 30 Hz when imbalance dominates.
That pattern is useful because it connects the measured motion to a physical source. It does not prove imbalance by itself: misalignment, loose mounting, bent shafts, aerodynamic forces, and structural resonance can create similar symptoms.
🧭 Define the project boundary first
Choose a machine with a guarded, accessible housing and a low-risk operating condition. Small DC motors with a firmly enclosed fan, benchtop blowers, or a deliberately unbalanced training rotor are generally better learning platforms than exposed high-speed tools.
Do not attach masses to an unknown rotor while it is running, bypass factory guards, or work around mains wiring unless you are qualified to do so. A homemade monitor observes vibration; it does not make an unsafe machine safe.
Set a simple question for the build: “Does vibration at running speed increase after a controlled change?” A narrow question produces clearer results than attempting to identify every possible mechanical fault at once.
🧰 Choose a practical sensor
An accelerometer is the most convenient sensor for this project. It measures acceleration along one, two, or three axes and is widely available in modules that communicate digitally with microcontrollers.
A three-axis MEMS accelerometer is especially helpful because vibration direction is not always obvious. MEMS means microelectromechanical system: a tiny internal structure moves under acceleration, and electronics measure that movement.
For a basic monitor, select a device with a sampling capability comfortably above the frequencies you expect to observe. A machine at a few thousand rpm produces a fundamental frequency of only tens of hertz, but harmonics and structural responses may be higher.
🧪 Compare sensor choices honestly
Not every vibration sensor answers the same question. The best choice depends on whether you want a simple indicator, a waveform for analysis, or reliable measurement over a demanding frequency range.
| Sensor type | Useful for | Main limitation |
|---|---|---|
| MEMS accelerometer | Affordable logging, direction, trend comparison | Noise, limited bandwidth, mounting sensitivity |
| Piezoelectric accelerometer | Higher-frequency machinery measurements | Usually needs suitable signal conditioning and mounting |
| Phone accelerometer | Quick demonstrations and rough comparisons | Unknown mounting, filtering, range, and sample behavior |
| Velocity pickup | Some established industrial vibration applications | Less convenient for a simple digital build |
A phone can be a useful first experiment, particularly for seeing that a change exists. Treat it as a qualitative instrument unless its sampling, mounting, and signal processing are known.
🧠 Understand acceleration, velocity, and displacement
Accelerometers report acceleration, commonly in g, where 1 g is approximately Earth’s gravitational acceleration. This is intuitive for sensor modules, but it is not the only way vibration is described.
Velocity emphasizes how fast the structure moves and displacement emphasizes how far it moves. Integrating acceleration can estimate these quantities, but integration magnifies low-frequency offsets and noise, so a simple DIY device should usually retain acceleration as its primary measurement.
For repeated tests, consistency matters more than converting every result into another unit. Compare the same metric, sensor location, operating speed, and acquisition settings.
🛒 Gather the core parts
A capable first build needs surprisingly little hardware. Choose parts that make data collection repeatable rather than chasing maximum specification.
- A three-axis digital accelerometer module
- A microcontroller board with serial output or removable storage
- Jumper wires and a small enclosure or strain-relieved cable arrangement
- A computer for viewing and saving data
- Mounting hardware: a small flat adapter, screw, clamp, or suitable adhesive
- A tachometer, optical sensor, or marked rotor for estimating rotational speed
- Basic safety equipment and a secure test stand
An optional LED or buzzer can provide a local warning when a chosen vibration trend is exceeded. Keep the logged signal, however, because a light alone cannot explain why an alarm occurred.
🔌 Wire for clean measurements
Follow the sensor module’s voltage requirements exactly. Many boards accept common logic voltages, but the sensing chip itself may not tolerate every supply level; check the documentation for the specific module rather than assuming.
Keep signal wires short, route them away from motor power leads where possible, and provide a common ground between the sensor and controller. Electrical interference may appear as false high-frequency activity or irregular spikes.
If a motor and microcontroller share a supply, voltage dips from motor startup can corrupt readings or reset the controller. Separate supplies with a proper common reference, or add appropriate filtering and decoupling, can improve stability.
📍 Mounting is part of the instrument
A vibration sensor does not measure “the machine” in the abstract. It measures the motion at its exact mounting point, filtered by the path between the source, structure, adapter, and sensor.
Mount the sensor on a rigid part of the bearing housing, motor casing, or machine frame near the suspected source. Avoid floppy covers, long brackets, loose cable loops, and thin panels if your purpose is to compare the rotating assembly itself.
Use the same location and orientation for every baseline and follow-up test. A different mount can alter the result enough to look like a mechanical change.
🧲 Select a mounting method with care
A screwed or stud-mounted sensor connection is generally the most repeatable when the structure permits it. A rigid clamp can also work well for temporary teaching rigs.
Adhesive pads and tape are convenient, but soft layers can attenuate or distort vibration, especially at higher frequencies. They may still be acceptable for low-frequency trend tests if the attachment method remains unchanged.
Magnetic mounts are useful on ferromagnetic surfaces but may introduce their own compliance. Whichever method you use, document it in the test notes; mounting is a measurement variable, not a minor detail.
🧭 Align the sensor axes
Label the sensor’s axes before installing it. For a horizontal motor, one axis may be radial, another axial along the shaft, and the third vertical or tangential depending on the orientation.
Imbalance often appears strongly in radial directions because the force acts outward from the shaft center. Axial motion may be more informative for some alignment or thrust-related issues, but real machines transmit motion through complex paths.
Start by logging all available axes. Later, compare both individual axes and a combined magnitude such as sqrt(x² + y² + z²), after accounting for the constant gravity component where appropriate.
⏱️ Match sampling rate to the machine
Sampling rate is the number of measurements collected each second. To represent a frequency, the sampling rate must exceed twice that frequency; this minimum is associated with the Nyquist principle.
In practice, sample several times faster than the highest feature you care about. If the rotor runs near 50 Hz and you want to see harmonics up to a few hundred hertz, a rate in the kilohertz range may be appropriate if the sensor and controller can sustain it.
Sampling too slowly causes aliasing: higher-frequency motion appears falsely as lower-frequency content. This can produce convincing but incorrect peaks, so do not infer a fault frequency beyond the capabilities of the acquisition setup.
🧹 Remove gravity and obvious bias
A stationary accelerometer senses gravity, so one axis may show approximately 1 g even when nothing is vibrating. Sensor offsets can add a smaller constant bias as well.
For a short vibration record, calculate and subtract the average of each axis before examining alternating motion. This centers the waveform around zero and helps reveal its fluctuating part.
Do not casually remove trends from data that include very slow machine motion without considering the consequence. Filtering is useful, but every filter changes the signal to some degree.
💻 Build the simplest useful data loop
The controller should read the accelerometer at a known interval, attach a timestamp or sample number, and send values to a serial terminal or file. Begin with raw values plus a clearly stated scale factor.
A practical record might contain time, x, y, z, estimated rpm, and a test label. Labels such as “baseline,” “after cleaning,” or “trial mass at 0 degrees” prevent later confusion.
For an initial display, calculate the absolute or RMS level over a fixed time window. RMS, or root mean square, is useful because it summarizes changing vibration energy without positive and negative values cancelling each other.
🧾 Use transparent pseudocode
The exact library calls vary by board and sensor, but the measurement logic is straightforward. Make the interval stable and avoid printing so much text that serial communication disrupts sampling.
initialize sensor and serial output
set sample_interval
loop:
  wait until next sample time
  read x, y, z acceleration
  subtract stored offsets if used
  save timestamp and readings
  add readings to current analysis window
  when window is full:
    calculate RMS and peak values
    report summary and reset window
Verify the actual sample rate by timing a known number of samples. A requested rate is not necessarily the rate achieved once sensor communication, computation, and file writing are included.
📈 Read a time waveform first
A time waveform plots acceleration against time. It is the best place to begin because it shows clipping, dropped samples, sudden impacts, and repeating shapes that may be hidden by a single summary number.
An imbalance-dominated waveform often looks relatively smooth and repetitive at steady speed. A loose component may create sharper impacts, while changing speed produces a waveform whose spacing changes over time.
Look at several seconds of stable operation rather than one visually appealing cycle. Real machines include noise, electrical interference, and structural responses that prevent perfectly sinusoidal traces.
📊 Use RMS and peak values for trending
RMS acceleration is a practical trend metric for repeated operating conditions. Peak acceleration highlights the largest excursion, which can be useful for impacts but is more sensitive to a single electrical glitch or handling event.
Record both if storage allows, along with the analysis window duration. A ten-second RMS value and a one-second RMS value are not directly equivalent when the machine behavior varies.
Do not treat a universal DIY threshold as a pass/fail limit. Meaningful alarm levels require machine-specific context, baseline data, operating conditions, and, for critical equipment, an appropriate vibration program.
🌊 See frequency content with an FFT
A fast Fourier transform, or FFT, converts a sampled waveform into frequency components. Instead of asking “how much did the casing move over time?” it asks “which repeating rates contributed to that motion?”
If a rotor speed is known, draw attention to the expected 1× frequency and its multiples. A rise near 1× that repeats across runs is consistent with imbalance, especially if it changes predictably with a controlled mass change.
FFT results require care. Frequency resolution depends on record length, and a changing speed smears energy across frequencies. Windowing can reduce edge effects, but it also affects amplitude interpretation.
🏷️ Measure speed rather than guessing it
Knowing rotational speed transforms vague vibration into a more useful diagnostic clue. Convert rpm to hertz by dividing by 60: a 1,800 rpm shaft has a running frequency near 30 Hz.
A handheld tachometer, optical reflective mark, Hall sensor with a magnet, or encoder can provide speed information. The method should not introduce a new imbalance or compromise guarding.
With a speed pulse, more advanced projects can use synchronous averaging or order tracking. For this build, simply recording stable rpm alongside vibration is already a major improvement over estimating speed by sound.
🧪 Establish a healthy baseline
Run the machine in its normal, stable condition before deliberately altering anything. Record several trials at the same speed, sensor position, warm-up state, and load where possible.
Repeatability matters because every machine has natural variation. If readings drift widely with no known change, investigate mounting, speed control, cable movement, sensor saturation, and environmental vibration before blaming the rotor.
Your baseline should include notes, not just files: date, configuration, fastener condition, rpm, sensor orientation, mounting method, and any unusual sound. Good diagnostics begin with good records.
⚖️ Create a controlled imbalance demonstration
For a training rotor designed to accept it, add a very small, securely retained trial mass at a known radius and angle while the machine is stopped. Then repeat the same measurement sequence at the same speed.
The expected observation is an increase in running-speed vibration, not necessarily an identical increase on every sensor axis. The structure may amplify some directions more than others.
Never improvise this on a fragile fan, grinder, saw, vehicle wheel, or unguarded rotor. If the test article is not designed for trial masses, use a purpose-built classroom rig or observe its existing condition only.
🧩 Distinguish imbalance from similar faults
Vibration is evidence, not a diagnosis. Several faults can overlap, and a simple monitor cannot separate them perfectly without additional measurements and mechanical inspection.
| Possible condition | Typical clue | Useful next check |
|---|---|---|
| Imbalance | Strong component near 1× speed, often radial | Inspect deposits, missing pieces, and mass distribution |
| Misalignment | May show axial vibration and harmonics | Check coupling and shaft alignment |
| Mechanical looseness | Impacts, harmonics, changing response | Inspect fasteners, feet, brackets, and clearances |
| Bearing damage | May create higher-frequency, non-synchronous features | Inspect lubrication, temperature, sound, and bearing condition |
| Resonance | Large response over a narrow speed region | Examine stiffness, support structure, and speed dependence |
These are general tendencies, not diagnostic rules. A loose mount can make an otherwise small imbalance appear severe, while a stiff structure can hide vibration at one measurement point.
🏗️ Watch for resonance
Every structure has natural frequencies at which it responds readily. When rotational forcing approaches one of these frequencies, vibration can rise sharply even if the underlying imbalance has not changed much.
A speed sweep is informative: increase speed gradually within safe operating limits and plot vibration against rpm. A narrow peak that appears only in a certain speed band suggests a structural response may be involved.
Do not solve a resonance problem merely by raising an alarm threshold. Possible remedies include changing stiffness, mass, support conditions, damping, or the operating speed range, after engineering review.
🛠️ Make basic corrections in the right order
Before attempting balancing, inspect simple causes. Dirt or product buildup, a missing blade fragment, a loose fastener, a shifted pulley, damaged isolator, or a bent guard can change vibration substantially.
Clean the rotor only with power isolated and according to the equipment procedure. Check that the machine is mounted on a sound base and that its feet are fully supported; a rocking machine can imitate or magnify fault symptoms.
If correction requires removing material, adding balance weights, machining, or altering a safety-critical rotating part, use the manufacturer’s procedure or a qualified balancing service. Field adjustments without proper retention and verification can create a serious hazard.
🎯 Understand what balancing actually requires
Static balancing addresses a heavy spot in one plane. It can be suitable for relatively narrow rotors, where the mass distribution behaves approximately as though it lies in a single disk.
Dynamic balancing addresses couple imbalance across two planes. A long rotor can be balanced statically yet still generate vibration because its mass distribution causes a rocking moment while it spins.
A single vibration sensor and trial mass experiment teaches the principle, but professional balancing typically uses phase information, controlled trial weights, known geometry, and careful safety procedures. The DIY monitor tells you when deeper work may be warranted.
🚨 Add an alert without creating false confidence
Once a baseline exists, define a conservative alert rule based on a sustained departure from normal behavior at comparable speed. Require several consecutive windows to exceed the rule so a single bump does not trigger an alarm.
Use alerts as prompts: inspect the machine, compare a new recording with baseline, and check operating conditions. Do not make the output a sole shutdown safeguard for equipment where failure could injure people or cause major damage.
A useful display might show current RMS, baseline RMS, rpm, sensor status, and a trend indicator. A sensor-disconnected warning is as valuable as a vibration warning; an absent or failed sensor should not look like a healthy machine.
🗂️ Keep data that can answer questions later
Save raw records for significant events, not just summary values. A future comparison may require a different filter, FFT setting, or time window that cannot be reconstructed from one RMS number.
Create a simple naming convention, such as machine name, date, rpm, and condition. Store configuration notes with the data, including sensor range, sampling rate, mounting location, and software version.
Over time, trend plots can reveal gradual changes that are easy to miss during casual checks. Trends are most reliable when operating conditions are comparable; a different load or speed can be a legitimate reason for a different vibration level.
⚠️ Recognize measurement limitations
Low-cost accelerometers can saturate, add noise, drift with temperature, or apply undocumented internal filtering. Their readings are still useful for education and trending when interpreted within their limits.
Sensor range matters. If the signal clips at the sensor’s maximum value, the waveform and frequency spectrum become distorted, often creating artificial harmonics. Reduce vibration safely, choose a suitable range, or relocate the sensor rather than analyzing clipped data.
Likewise, a sensor mounted on a flexible cover may report the cover’s resonant motion more than the bearing housing’s motion. The monitor is a window into a specific measurement point, not an all-knowing fault detector.
❌ Avoid common build mistakes
Many disappointing results come from measurement practice rather than programming errors. Correct these basics before adding complex algorithms.
- Comparing readings taken at different rpm without recording speed
- Using tape or a loose clamp differently on each test
- Sampling too slowly and mistaking aliasing for low-frequency vibration
- Ignoring clipped data or motor-induced electrical noise
- Looking only at a total magnitude and never examining the waveform
- Declaring imbalance from one elevated reading without inspection
- Adding trial mass to a rotor not designed for the experiment
The remedy is usually disciplined repetition: same operating point, same sensor mount, documented conditions, and a baseline collected before conclusions are drawn.
🧑🏫 Turn the build into a learning exercise
For students, this monitor can support a compact experimental sequence. Measure a baseline, alter one condition at a time on a safe training rig, and compare time waveforms, RMS trends, and FFT peaks.
Useful questions include: Does vibration increase with speed as expected? Which axis responds most strongly? Does moving the sensor change the apparent amplitude? Does a flexible support introduce a resonant peak?
For working professionals, the same exercise clarifies why field data needs context. It encourages better notes, more repeatable routes, and a healthy reluctance to diagnose a machine from one indicator alone.
🔍 Extend the monitor thoughtfully
After the basic version works, add one improvement at a time. An optical speed input is often the most valuable next step because it ties measured frequencies directly to shaft rotation.
Other extensions include an enclosure with a fixed mounting interface, data logging to removable storage, a small screen, wireless transfer, temperature sensing, or automated spectral plots on a computer. Each adds convenience but also adds possible failure modes.
More advanced analysis, such as phase measurement, envelope detection, and order tracking, is worthwhile only when the sensor, sampling method, speed reference, and mechanical question justify it. Complexity should improve a decision, not merely decorate the project.
✅ The core principle to carry forward
A useful vibration monitor is built from more than an accelerometer and a graph. It combines a securely mounted sensor, adequate sampling, known rotational speed, a repeatable baseline, and cautious interpretation.
Imbalance creates a rotating force that commonly appears near running speed, but the machine structure determines how that force becomes measurable motion. That is why the same rotor can look quiet at one location and lively at another, or change dramatically near resonance.
The most valuable outcome is not a universal alarm number. It is the ability to notice a credible change, connect it to operating conditions, inspect likely causes, and escalate responsibly when the evidence calls for it.
Build the monitor to compare like with like, and let repeatable evidence guide every maintenance decision. A small, carefully used instrument can teach excellent diagnostic habits long before it becomes a sophisticated system. ⚙️📈🛠️