
A shaft slides smoothly through a seal during assembly, but begins to leak after a few hours of operation. A machined plate looks polished, yet its coating peels earlier than expected. A bearing race meets every visible dimensional requirement and still produces more noise than the previous batch.
In each case, the missing variable may be the same: the texture of the surface at a scale too small to judge by eye. A part can have the correct diameter, flatness, and material while its microscopic peaks and valleys make it unsuitable for its actual job.
Surface roughness measurement turns that texture into usable engineering information. It helps designers specify function, machinists select processes, inspectors verify production, and maintenance teams investigate wear or failure.
The goal is not to make every surface as smooth as possible. The goal is to create—and verify—the surface condition that lets a mechanical part seal, slide, grip, carry load, retain lubricant, accept a coating, or fit another component reliably.
🔍 What Surface Roughness Actually Means
Surface roughness describes the relatively fine, closely spaced deviations of a real surface from its ideal geometric form. Under magnification, even a carefully machined face contains tiny ridges, scratches, tool marks, pits, and valleys.
Roughness is only one part of surface texture. Texture can also include larger repeating patterns and broad shape errors. Keeping these scales separate prevents a common inspection mistake: trying to assess a waviness or form problem with a roughness value alone.
🗺️ Roughness, Waviness, and Form Are Different Scales
Form refers to the overall intended shape, such as whether a shaft is truly cylindrical or a face is flat. Waviness is a longer-spaced pattern, often caused by vibration, machine deflection, thermal effects, or an unstable setup.
Roughness is the finer texture left by cutting edges, abrasive grains, material tearing, or other local mechanisms. A turned shaft may have acceptable roughness but noticeable waviness from chatter; its seal can still leak because the seal follows the larger undulations.
In practice, the instrument settings and evaluation length determine which scale is emphasized. That is why a roughness result is meaningful only when the measurement conditions travel with the number.
📏 Why a Single Smoothness Number Is Not Enough
A roughness value is a summary of a surface profile, not a complete picture of that profile. Two surfaces can report the same average roughness while having very different peak shapes, valley depths, and directional patterns.
Imagine two roads with the same average bump height. One has rounded rolling bumps; the other has occasional sharp potholes. A tire, a lubricant film, or a seal will respond differently to each road even if one average number happens to match.
For routine production control, one parameter may be entirely appropriate. For demanding sealing, fatigue, optical, bearing, or coating applications, engineers often need a more complete set of texture parameters and a visual review of the trace.
📐 The Profile and the Mean Line
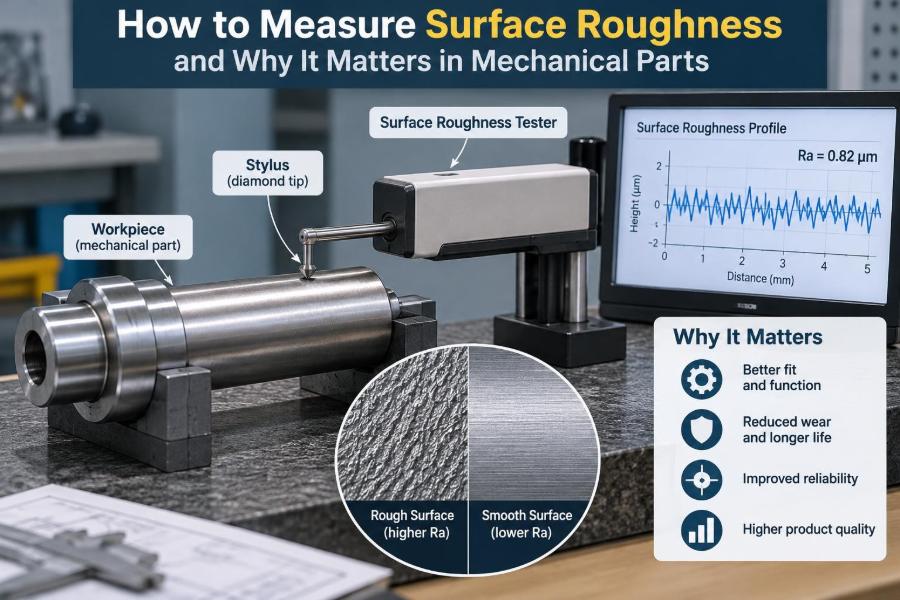
Most traditional surface roughness measurements begin with a two-dimensional profile: a line traced across the surface. Software filters that trace to isolate roughness, then establishes a mean line from which heights and depths are calculated.
Peaks above this line are positive deviations and valleys below it are negative deviations. The instrument samples many points along the traverse, converting stylus movement or optical data into a height-versus-distance record.
This explains a key limitation: a line profile only sees what lies along that line. A three-dimensional areal measurement can reveal features between lines, such as isolated pits, pores, and the directional structure of a honed or blasted surface.
📊 Ra: The Most Common Roughness Parameter
Ra, arithmetic average roughness, is the average of the absolute height deviations from the mean line over the evaluation length. It is widely used because it is straightforward, stable for many production surfaces, and familiar on drawings.
Ra is useful for comparing consistent processes, such as a well-controlled grinding operation. But averaging hides extremes. A surface with rare deep scratches may still show a modest Ra, even though those scratches create a leak path or stress concentration.
Think of Ra as an efficient first description, not a universal functional guarantee. Always ask what feature is most likely to control performance before selecting it as the sole acceptance parameter.
📈 Rz, Rt, and Peak-to-Valley Information
Rz is commonly used to describe the average height difference between significant profile peaks and valleys across sampling lengths, although exact definitions can depend on the standard and instrument configuration. Rt represents the total height range over the evaluation length.
These parameters are more sensitive than Ra to pronounced defects and large profile excursions. They can be helpful where high asperities—the tiny contact points between surfaces—must be limited to reduce wear, indentation, or leakage.
That sensitivity has a trade-off. A small scratch, bit of contamination, or poor measurement location can change Rz or Rt substantially. When using them, take repeat measurements and investigate unusual traces instead of treating every high value as a machining failure.
🏔️ Skewness and Kurtosis Describe Shape
Some applications care about whether the surface has mostly peaks, mostly valleys, or a few unusually sharp features. Skewness describes the asymmetry of the height distribution. A negative-skewed surface tends to have more valley capacity, while a positive-skewed surface is more peak-dominated.
Kurtosis indicates how strongly the distribution is concentrated around the center and whether extreme features are present. These statistical descriptors are not always needed on drawings, but they can help diagnose why surfaces with similar Ra behave differently.
They are particularly relevant when a running-in period is expected. A plateau-honed cylinder liner, for example, is designed with load-bearing plateaus and valleys that can retain lubricant; Ra alone cannot fully describe that functional structure.
🧭 Lay: The Direction of Surface Marks
Lay is the predominant direction of a surface pattern. Turning usually leaves circumferential or helical marks, milling leaves a directional pattern related to cutter travel, and grinding creates lines linked to wheel motion.
Lay matters because many mating systems are directional. A dynamic seal running across deep grooves may pump fluid along them. A sliding contact moving across tool marks can experience different friction than one moving parallel to them.
When inspecting a directional surface with a stylus, the usual objective is to traverse perpendicular to the lay so the probe crosses the texture rather than following along a groove. The drawing, process plan, and inspection procedure should agree on that orientation.
⚙️ How Manufacturing Processes Create Texture
Every process leaves a characteristic signature. In turning, feed rate, tool nose geometry, tool wear, material buildup, and vibration influence the pattern. In milling, cutter runout, tooth marks, stepover, and fixturing can dominate the result.
Grinding generally produces a finer texture, but wheel condition, dressing practice, coolant delivery, and thermal damage still matter. Honing, lapping, polishing, abrasive blasting, and additive manufacturing create textures with very different geometries and functional behavior.
Process knowledge makes measurement more useful. A sudden roughness shift is not just an inspection result; it may point toward a worn insert, clogged wheel, incorrect feed, damaged fixture, or changed workpiece material.
🧰 The Stylus Profilometer
A contact stylus profilometer is one of the most common instruments for measuring surface roughness. A small diamond-tipped stylus travels across the part while a sensitive pickup records its vertical movement.
The system applies filtering and calculation rules to generate parameters such as Ra, Rz, and Rt. It can also display the profile, which is often more informative than the final numerical result when troubleshooting.
Stylus instruments are practical and well suited to many machined surfaces. Their limitations include access to tight features, possible difficulty on very soft or delicate materials, and the fact that a finite-radius stylus cannot enter valleys narrower than its tip geometry allows.
🔬 Optical and Non-Contact Measurement Methods
Optical profilers measure surface topography without dragging a tip across the part. Depending on the instrument, methods may use focus variation, confocal microscopy, interferometry, or structured light to reconstruct a surface map.
These methods can be valuable for soft coatings, polished surfaces, microfeatures, or complex textures where a three-dimensional view is needed. They can also measure areas more quickly than making many separate stylus traces.
Non-contact does not mean error-free. Reflective, transparent, steep, dark, or highly textured surfaces can challenge optical systems. Measurement settings, illumination, objective selection, and data-processing choices need validation for the surface being assessed.
🧪 Comparing Common Measurement Approaches
| Approach | Best suited to | Practical strength | Important limitation |
|---|---|---|---|
| Stylus profilometer | General machined profiles | Established parameters and direct profile traces | Contact, limited access, line-based data |
| Optical profiler | Delicate, fine, or areal textures | Fast 3D maps without stylus contact | Surface optics and steep slopes can affect data |
| Replica tape or comparator | Field screening and coarse surfaces | Portable and simple | Limited detail and lower analytical capability |
| Atomic-force methods | Nanoscale research features | Very high spatial resolution | Small scan area and slower operation |
The right method depends on feature scale, material, access, required uncertainty, production speed, and the parameter specified. A sophisticated instrument is not automatically better if its data cannot be related clearly to the part’s function or drawing requirement.
🧹 Prepare the Part Before Measuring
Cleanliness matters because loose chips, dried coolant, oil droplets, fingerprints, and abrasive dust can look like real topography. Wipe the part using a compatible method, allow it to stabilize if temperature is changing, and avoid touching the measurement area afterward.
Inspect the region visually under appropriate light. A visible burr, dent, or handling scratch may be a legitimate defect, but it should not be mistaken for the normal production texture when establishing process capability.
For critical parts, define cleaning and handling in the inspection instruction. Repeatable preparation is part of repeatable measurement.
📍 Choose a Representative Measurement Location
Surface texture can vary across a single part. The center of a face-milled surface may differ from the tool entry and exit regions. A shaft may differ near a shoulder, keyway, or chucking zone. Coated parts may vary near edges.
Measure the functional region whenever possible. If a seal runs on a specific band of a shaft, that band matters more than an arbitrary accessible spot. If the entire surface is functional, sample multiple locations using a defined pattern.
Do not measure directly on burrs, damaged edges, holes, or interruptions unless those features are intentionally included in the acceptance requirement. The location must be traceable so a result can be repeated later.
📏 Cutoff Length and Evaluation Length Control the Result
A roughness instrument uses filtering to separate shorter-spaced roughness from longer-spaced waviness. The cutoff length sets the boundary of that separation, while the evaluation length is the total profile length used to calculate the reported result.
Using a cutoff that is too short can remove meaningful texture. Using one that is too long can allow waviness to influence a roughness result. The appropriate setting depends on the expected surface spacing, the drawing requirement, and the governing measurement standard or procedure.
Never compare two Ra values confidently if their cutoff, filter, and evaluation length are unknown or different. The same physical surface can produce different values under different settings without either instrument being defective.
🧭 Set the Traverse Direction Correctly
For surfaces with a clear lay, make the stylus traverse perpendicular to the dominant marks unless the specification says otherwise. This provides a profile that crosses peaks and valleys in a representative way.
A trace parallel to turning or grinding marks may understate their height variation because the stylus follows the direction of the grooves. On isotropic textures, such as some blasted or lapped surfaces, direction is less dominant, but repeatable orientation remains good practice.
For complex functional textures, one direction may not be enough. Consider multiple traces or areal measurement when the performance depends on texture in more than one direction.
🧩 Fixturing Prevents False Roughness
Part movement, instrument vibration, a tilted workpiece, or an unstable stand can introduce artificial features into the trace. A profilometer is sensitive enough that poor support may resemble waviness or roughness.
Support the workpiece securely without deforming it. Align the measurement path with the intended surface and ensure that the stylus can enter and leave the trace without striking an edge or adjacent feature.
On small components, a simple dedicated nest often improves repeatability more than extra software processing. The best measurement system controls mechanical setup before attempting to correct data afterward.
✅ Calibrate and Verify the Instrument
Calibration establishes the relationship between the instrument’s response and a known reference. Routine verification checks that the system remains within acceptable performance before or during use.
Use the reference artifact and procedure recommended for the instrument and measurement range. Keep the artifact clean, protected, and traceable within the quality system. A damaged reference cannot confirm reliable readings.
Verification is especially important after stylus replacement, relocation, maintenance, a suspected crash, or unusual measurement results. It does not replace proper setup, but it helps separate instrument problems from part variation.
🧾 Read a Surface-Finish Specification Carefully
A drawing may state a roughness parameter and limit, but a complete requirement can also include the measurement direction, sampling rules, machining allowance, lay symbol, filtering conditions, or a reference to a company or industry standard.
Units deserve close attention. Roughness may be reported in micrometres or microinches. A unit conversion error can turn an acceptable component into an apparent major nonconformance—or allow a truly rough surface to pass by mistake.
If the drawing simply says “surface finish” with no parameter, method, or unit, it is incomplete as an inspection instruction. Engineers should clarify the functional intent rather than relying on assumptions made by different suppliers or inspectors.
🛢️ Why Roughness Matters for Seals and Leakage
Seals need a surface that supports controlled contact without providing continuous channels for fluid or gas to escape. Excessively rough peaks can abrade the sealing lip, while deep directional grooves may create a path that encourages leakage.
But an extremely smooth surface is not always best. Some seals need a suitable texture to retain a thin lubricating film, and the ideal finish depends on seal material, pressure, motion, fluid, speed, and shaft geometry.
A hypothetical example is a pump shaft with good Ra but spiral turning marks. The average value may meet the drawing, yet the lay acts like a tiny screw under rotation. In such a case, direction and profile character deserve investigation alongside Ra.
🧊 Friction, Wear, and Lubrication
Real contact occurs at microscopic asperities, not across the entire apparent area. Rough peaks can concentrate load, deform, break off, or plow against the opposing surface, particularly during start-stop motion or inadequate lubrication.
At the same time, valleys can store lubricant and capture wear debris. The useful texture depends on the lubrication regime: boundary lubrication, mixed lubrication, and full-film fluid lubrication respond differently to surface topography.
Surface finish should therefore be selected as part of a tribological system, not as an isolated cosmetic requirement. Material pair, load, speed, temperature, lubricant, and contamination all influence the outcome.
🧱 Fatigue Strength and Stress Concentration
Sharp scratches, machining tears, and deep valleys can locally increase stress under cyclic loading. If they lie in a highly stressed direction or at a notch-sensitive location, they may become initiation sites for fatigue cracks.
Improving surface finish can help fatigue performance in some applications, but it is not a substitute for correct material condition, geometry, residual stress control, and heat treatment. Polishing can also alter edges or remove material in ways that matter to a tightly controlled part.
For fatigue-critical components, inspect surface damage separately from normal roughness. A compliant average roughness value does not prove the absence of isolated defects.
🎨 Coatings, Adhesion, and Surface Preparation
Paints, thermal sprays, plated layers, adhesives, and some conversion coatings need a surface condition that supports mechanical interlocking or chemical bonding. A surface that is too smooth may offer limited anchoring; one that is too rough may trap contamination or create high spots that receive uneven coverage.
Preparation requirements should state more than “roughen the surface.” They should identify the process, cleaning condition, profile range where relevant, and inspection method. Different coating systems respond differently to blasting media, abrasion, and substrate condition.
Measure after the surface is prepared but before it is contaminated by handling or exposed long enough for problematic oxidation in sensitive applications.
🔩 Fits, Assembly, and Contact Stiffness
Dimensional tolerances describe nominal geometry, but roughness affects the real contact between assembled parts. High peaks can flatten during pressing or bolting, changing seating behavior and the effective interference in a fit.
On precision sliding fits, rough peaks may raise friction or promote scuffing. On bolted joints, surface texture affects how interfaces settle under clamp load. These effects are often small compared with gross dimensional error, but they matter in precision or heavily loaded assemblies.
When assembly force changes unexpectedly, check dimensions, lubrication, alignment, burrs, and roughness together. Treating them as independent variables can miss the interacting cause.
🧯 Common Measurement Mistakes
- Reporting Ra without units, cutoff, filter, evaluation length, or traverse direction.
- Measuring over dirt, coolant residue, burrs, or a handling scratch.
- Tracing parallel to a strongly directional lay when the goal is to characterize its height.
- Using only one convenient location on a surface known to vary across the part.
- Accepting a number without examining an obviously abnormal profile trace.
- Comparing stylus and optical results without confirming equivalent filtering and parameter definitions.
- Specifying an unnecessarily fine finish that adds cost without improving function.
Most of these mistakes are procedural rather than mathematical. A clear work instruction and a short operator training session can eliminate many inconsistent results.
🧠 Build a Practical Measurement Plan
A useful plan begins with function. Ask what the surface must do: seal, slide, resist fatigue, bond a coating, carry load, conduct heat, reflect light, or simply provide a safe handling finish.
- Identify the functional surface and likely failure mechanisms.
- Select meaningful parameters, limits, direction, and measurement method.
- Define cleaning, fixturing, location, sampling quantity, and acceptance rules.
- Set cutoff, evaluation length, and filtering conditions in the procedure.
- Verify the instrument and document results with traceable part information.
- Use trends to improve the process rather than only sorting good and bad parts.
For critical components, involve design, manufacturing, quality, and suppliers early. A requirement that is easy to state but difficult to measure consistently is not a robust production requirement.
📉 Use Trends to Control the Process
Individual inspections tell you whether sampled parts meet a current requirement. A sequence of results can reveal process behavior: gradual tool wear, wheel loading, thermal drift, machine vibration, or changes between material batches.
Plot results in time order and investigate meaningful shifts before they become out-of-specification parts. Pair roughness trends with information such as tool life, feeds and speeds, coolant condition, machine alarms, and operator changes.
Do not overreact to normal measurement variation. The purpose of trending is to distinguish a stable process from a changing one, using a measurement method whose repeatability is understood.
💰 Avoid Over-Specifying Surface Finish
A finer finish often requires slower machining, additional grinding, honing, polishing, tighter process control, or more inspection time. Those steps can raise cost and sometimes introduce new risks, such as thermal damage or altered geometry.
Specifying the lowest possible Ra “just to be safe” is rarely good engineering. It may reduce supplier options while providing no functional benefit. Conversely, a loose requirement can cause avoidable wear, leakage, noise, or assembly problems.
The best specification reflects demonstrated functional need. Where possible, validate it through prototype testing, prior product experience, or controlled comparison rather than appearance alone.
🧭 When to Use Areal Surface Texture
Profile parameters remain effective for many traditional machined parts, especially where the functional interaction occurs along a known direction. However, surfaces with random, cellular, porous, cross-hatched, or additive-manufactured textures may be better described as an area.
Areal measurements can quantify height distribution, peak density, valley volume, and spatial patterns over a selected field. They reduce the risk that one favorable or unfavorable line dominates the conclusion.
They also require careful choices about scan area, resolution, filtering, and missing data. Switching to 3D measurement should be driven by function and texture complexity, not simply by instrument novelty.
🧩 Investigate a Bad Result Systematically
When a roughness result fails, first confirm the measurement. Reclean the surface, verify the instrument, repeat at defined locations, and review the trace for contamination, edge effects, or stylus damage.
Then compare the part with process evidence. Check tool condition, wheel dressing, spindle behavior, fixturing, coolant, program changes, material condition, and whether the measured lay matches the expected process signature.
Finally, separate a roughness issue from a broader texture problem. A chatter pattern may be principally waviness; a single gouge may be handling damage; a shift in multiple parameters may indicate genuine process deterioration.
🎯 The Core Principle: Specify Function, Then Measure Consistently
Surface roughness matters because mechanical interfaces operate on real surfaces, not ideal lines on a drawing. Microscopic texture changes how parts seal, wear, lubricate, adhere, fatigue, assemble, and sound in service.
Reliable results come from a chain of decisions: selecting a parameter that reflects function, choosing the right instrument, preparing and locating the part consistently, setting the correct filter and traverse direction, and interpreting the trace rather than trusting a number blindly.
The best surface-finish requirement is not the finest possible value; it is a measurable, repeatable texture requirement that supports the part’s intended function.
Measure the surface in the same thoughtful way you design the interface: with the operating conditions, failure modes, and manufacturing process all in view. That approach turns roughness from a drawing symbol into a practical tool for better mechanical parts. ⚙️📏🔍