
A production line is running normally when a pump begins to sound slightly rougher than usual. Its discharge pressure is still acceptable, no alarm has appeared, and stopping it would interrupt a busy shift. The easy decision is to keep operating.
Weeks later, the pump trips on high vibration. The repair is no longer a planned bearing change; it has become a damaged shaft, contaminated lubricant, lost production, and an urgent search for spare parts.
Many machine failures begin this way: not as a dramatic event, but as several small changes that seem unrelated. A bearing warms a little, vibration develops a new frequency component, and the motor draws more current under a particular load.
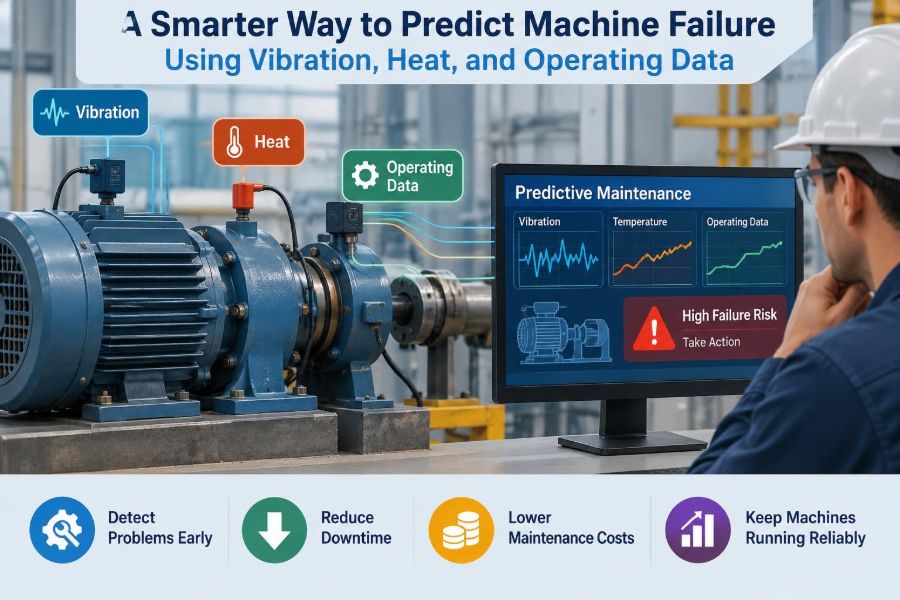
Predictive maintenance aims to connect those clues early enough to make a better decision. The most useful approach does not treat vibration, temperature, and operating data as competing signals. It combines them into evidence about the machine’s changing condition.
🔍 What “Predicting Failure” Actually Means
Predicting machine failure rarely means naming the exact hour when a component will break. In practical engineering, it means identifying a developing fault, estimating its seriousness, and deciding whether the asset can safely run until a planned intervention.
This is often called condition-based maintenance: maintenance triggered by measured condition rather than a fixed calendar interval. It sits between reactive maintenance, which waits for failure, and purely preventive maintenance, which replaces parts according to time or operating hours.
A useful prediction therefore answers three questions: What is changing? What fault could explain that change? What action is justified at the current risk level?
🧭 Why One Sensor Is Rarely Enough
A high temperature may result from a damaged bearing, but also from a hot ambient environment, blocked ventilation, heavy loading, or a sensor mounted near a heat source. A vibration increase may indicate imbalance, misalignment, looseness, cavitation, or a simple change in speed.
Each measurement is incomplete on its own. Combining measurements reduces ambiguity because different faults leave different patterns across the machine.
For example, rising bearing-temperature and high-frequency vibration together support a lubrication or rolling-element bearing concern more strongly than either observation alone. If load and speed have remained steady, that interpretation becomes stronger still.
📈 The Three Main Evidence Streams
Most practical predictive-maintenance systems begin with three categories of information:
- Vibration data shows motion, impacts, resonance, and periodic forcing.
- Thermal data shows friction, electrical losses, poor cooling, and abnormal heat transfer.
- Operating data provides context: speed, load, pressure, flow, torque, current, valve position, and start-stop history.
Other evidence can be valuable, including lubricant analysis, ultrasound, acoustic emissions, and visual inspection. The three streams above are especially useful because they can be collected continuously or frequently on many rotating assets.
🌊 Vibration Is a Mechanical Fingerprint
Vibration is the oscillatory motion of a machine or structure around its intended position. Rotating equipment always vibrates to some degree; the question is whether the pattern is stable, appropriate for the machine, and consistent with its operating condition.
Accelerometers commonly measure acceleration, while velocity and displacement may be derived or measured for particular applications. The preferred quantity depends on machine type, frequency range, mounting arrangement, and the fault being investigated.
A vibration waveform is like a recording of motion over time. It may look complex, but processing can reveal repeating frequencies that relate to shaft rotation, gear meshing, blade passage, or bearing geometry.
🎵 From Time Waveform to Frequency Spectrum
A time waveform can expose impacts, looseness, and transient events. A frequency spectrum separates that waveform into its frequency components, making periodic sources easier to identify.
Suppose a shaft rotates at 30 Hz, or 1,800 rpm. A strong component near 30 Hz may be associated with rotational effects. Harmonics at multiples of that speed, such as 60 Hz or 90 Hz, can add useful clues, though no single frequency should be diagnosed without context.
Spectral analysis is powerful because mechanical components operate with recognizable repetition rates. It is not a shortcut around engineering judgment: speed variation, structural resonance, signal quality, and machine design all affect the result.
⚖️ Common Vibration Signatures and Their Limits
| Observed pattern | Possible explanation | Useful cross-check |
|---|---|---|
| High vibration near running speed | Imbalance, eccentricity, or process forcing | Speed, phase, recent rotor changes |
| Strong harmonics of running speed | Misalignment, looseness, or distortion | Alignment condition, base stiffness, temperature |
| High-frequency impacts | Rolling-bearing distress or poor lubrication | Envelope spectrum, lubricant condition, bearing temperature |
| Components related to gear mesh | Gear wear, tooth damage, or load variation | Torque, oil debris, inspection history |
| Broadband elevated vibration | Cavitation, rubbing, turbulence, or structural excitation | Pressure, flow, sound, operating point |
These are diagnostic starting points, not universal rules. A resonance can amplify a harmless forcing frequency, while a severe fault may be partly hidden by noise or a poor sensor location.
🌡️ Heat Is Evidence, Not a Verdict
Temperature rises when a machine generates more heat than it can reject. Friction, electrical resistance, fluid losses, inadequate lubrication, and restricted cooling can all contribute.
Thermal measurements are often easy to understand, but they respond more slowly than vibration. A bearing can develop early damage before its housing temperature changes noticeably; conversely, a warm housing may simply reflect high process temperature.
The most informative value is often not an absolute temperature but a trend under comparable conditions. A bearing consistently operating warmer than its similar counterpart at the same load deserves investigation.
📍 Temperature Sensor Location Changes the Story
A sensor on a bearing housing measures housing temperature, not the rolling contact temperature inside the bearing. Heat must travel through metal, grease, interfaces, and air before reaching the sensor.
Place sensors consistently and document their locations. A reading near a motor winding, oil return line, or gearbox casing cannot be compared directly with one on an outer bearing pedestal.
Infrared thermography is useful for surveys, electrical panels, couplings, and inaccessible surfaces, but emissivity, viewing angle, surface finish, and reflected radiation can distort an apparent temperature. A painted dull surface generally behaves differently from polished metal.
🏭 Operating Context Explains the Measurements
A machine does not have one normal condition. A fan at low flow behaves differently from the same fan near its design point. A compressor at high pressure ratio, a conveyor with a heavy load, and a pump operating near a restrictive valve all experience different forces and temperatures.
Operating data turns raw sensor values into interpretable condition information. At a minimum, record when practical:
- rotational speed or drive frequency;
- load, torque, motor current, or power;
- process pressure, flow, temperature, or level;
- operating mode, recipe, and start-stop state.
Without this context, a condition-monitoring system can mistake a legitimate duty change for deterioration.
🧮 Build a Baseline Before Setting Alarms
A baseline is a reference picture of a machine operating acceptably. It should include measured condition data and the operating state in which it was collected.
Collecting a baseline immediately after correct installation, alignment, balancing, and lubrication is ideal. In reality, many plants start with equipment already in service. That is still useful, provided the first dataset is treated as a working reference rather than proof of perfect health.
For variable-speed equipment, create baselines by operating region. Comparing vibration at 1,500 rpm with vibration at 900 rpm may be misleading unless the values are normalized or modeled against speed.
📉 Trends Matter More Than Isolated Readings
A single high reading should prompt a check of sensor attachment, process condition, and repeatability. A gradual, repeatable rise over several comparable runs is usually more meaningful.
Trend plots reveal rate of change. A stable but elevated measurement may be acceptable for a known machine condition, while a lower measurement that is accelerating upward may require faster action.
Use enough history to see normal variation. Weather, production schedules, product changes, and maintenance activities can create patterns that look alarming when viewed over only a day or two.
🚦 Use Alert Bands Instead of a Single Magic Limit
One universal threshold is tempting because it is simple. It is also often misleading. Machine size, stiffness, speed, measurement direction, mounting method, and process duty all influence expected vibration and temperature.
A more practical system uses alert bands: normal, watch, alarm, and urgent review. These bands can incorporate absolute engineering limits where applicable, but should also consider deviation from the asset’s own baseline.
Alarm design must include a response. An alarm that nobody owns, understands, or can investigate becomes background noise rather than a safety net.
🧠 Sensor Fusion Means Combining Evidence Carefully
Sensor fusion is the structured combination of multiple measurements to improve a condition assessment. It does not require advanced artificial intelligence. A simple rule can be valuable: investigate a bearing when high-frequency vibration rises and bearing temperature is above its normal load-adjusted range.
More advanced systems may combine features mathematically, calculate a health index, or use models trained on historical labeled data. Their output should remain traceable to signals engineers can review.
The goal is not to create a mysterious score. It is to make a more defensible maintenance decision from evidence that is stronger together than separately.
🔄 Match Signals to the Failure Mechanism
Different mechanisms develop on different timescales. Imbalance may appear as a relatively stable running-speed vibration signature. Lubrication degradation can gradually raise friction and bearing-related vibration. A loose foundation may change with temperature, load, or repeated starts.
Consider the physical path from fault to measurement. A bearing defect produces impacts at the bearing, which travel through the housing to an accelerometer. A cooling blockage produces heat, which reaches a temperature sensor after a delay. Understanding this path prevents unrealistic expectations from the data.
🛢️ Bearings: A Useful Multisignal Example
Rolling-element bearings are frequent monitoring targets because they are critical, common, and capable of producing detectable symptoms. Yet “high vibration equals bad bearing” is an oversimplification.
An early bearing issue may produce subtle repetitive impacts in high-frequency data. As damage grows, vibration can increase, lubricant may show wear debris, and heat may rise if friction or lubrication quality worsens.
A hypothetical example illustrates the logic: a pump bearing shows increasing enveloped vibration over several weekly readings, while temperature rises only during high-load operation. The maintenance team checks lubrication quantity, alignment, and hydraulic operating point before deciding whether a planned replacement is justified. That is better than either ignoring the trend or replacing the bearing solely because one indicator changed.
💧 Pumps Need Process Data to Diagnose Well
Pump vibration can originate in mechanical faults, but the hydraulic system is often involved. Low suction pressure, entrained gas, recirculation, blockage, or operation far from the preferred flow region can create unstable forces and noise.
Cavitation is a particularly important possibility: vapor bubbles form and collapse when local pressure conditions permit. It can create broadband vibration, sound, and damage, but a vibration sensor alone cannot confirm every suspected case.
Compare vibration with suction and discharge conditions, flow, valve position, and process temperature. Correcting the operating point may reduce the symptom more effectively than repeated mechanical repairs.
⚡ Motors and Drives Add Electrical Clues
Motor current, voltage quality, winding temperature, and drive frequency add context to mechanical data. A motor under greater load naturally draws more current and may run warmer; this can explain changes in vibration amplitude that would otherwise appear suspicious.
Variable-frequency drives complicate interpretation because speed changes, electrical switching effects, and resonance crossings can alter observed signals. Trend data should therefore be grouped by speed range and operating mode.
Electrical measurements can complement vibration, but they do not replace mechanical inspection. A current signature may suggest load or rotor-related concerns while leaving the exact mechanical cause uncertain.
🏗️ Gearboxes Reward Frequency-Based Analysis
Gearboxes contain rotating shafts, meshing teeth, bearings, and a lubricated enclosure. Their vibration spectra can include shaft frequencies, gear-mesh frequencies, sidebands, and bearing-related components.
Changes around gear-mesh frequencies may indicate tooth wear, eccentricity, misalignment, or changing load. Oil analysis and inspection ports can provide valuable confirmation because they observe a different consequence of the same problem.
Gearbox temperature is useful for detecting severe friction or cooling issues, but it is usually too nonspecific to diagnose tooth condition alone. Treat it as part of a combined picture.
🧱 Installation Quality Can Mimic Failure
Soft foot, loose bolts, distorted bases, pipe strain, poor grout, and inadequate structural stiffness can all produce vibration patterns that resemble internal machine defects. Replacing a bearing without correcting its environment may simply restart the failure cycle.
Before making a costly diagnosis, inspect the basics: fasteners, base condition, coupling alignment, guarding contact, piping supports, and signs of movement. A machine is connected to a system; its measurements reflect that system.
This is one reason field observations remain essential even in highly instrumented facilities.
🧰 Choose Sensors for the Decision You Need
Not every asset needs continuous high-resolution vibration monitoring. A small, noncritical fan may be adequately covered by periodic route-based checks. A critical compressor with long spare-part lead times may justify permanently installed sensors and automated data collection.
Selection should consider consequence of failure, detectability, duty cycle, access, environmental exposure, repair duration, and the likely failure modes. Start with the decision the measurement must support, then choose the instrument.
Wireless sensors can reduce installation effort, but battery life, transmission reliability, sampling strategy, and cybersecurity still require engineering attention.
🔩 Mounting and Sampling Can Make or Break Data
An accelerometer mounted rigidly near a bearing usually captures higher-frequency content more reliably than one attached to a thin, flexible guard. A loose magnetic mount, damaged cable, or inconsistent hand-held probe position can create misleading variation.
Sampling must suit the frequencies of interest. If the sampling rate is too low, high-frequency information can be lost or distorted through aliasing. If data are collected too infrequently, short-lived events and rapid deterioration may be missed.
Document sensor type, direction, location, orientation, units, filter settings, and sampling setup. Condition data without measurement metadata is difficult to compare or audit.
🧹 Data Quality Comes Before Analytics
Advanced analytics cannot repair a dataset dominated by missing timestamps, mixed units, faulty sensors, and unrecorded operating states. Data quality work is not glamorous, but it determines whether predictions are credible.
Useful checks include range validation, time synchronization, sensor-health monitoring, calibration practices, and flags for maintenance work. A sudden signal change after a sensor replacement should not automatically be treated as a machine event.
Also preserve maintenance history. The date of lubrication, alignment, bearing replacement, and process modification helps explain whether a trend responded to an intervention.
🤖 Where Machine Learning Helps—and Where It Does Not
Machine-learning methods can find patterns in large, multivariable datasets, identify unusual behavior, and prioritize assets for review. They are most useful when there is reliable data, consistent operating context, and a clear workflow for validating alerts.
They struggle when failures are rare, labels are uncertain, sensor setups change frequently, or the process itself changes faster than the model can adapt. A model trained on one pump and installation may not transfer cleanly to another.
Use machine learning as decision support, not as an unchallengeable authority. Engineers should be able to compare an alert with raw trends, spectra, operating conditions, and physical inspection.
🕒 Estimate Remaining Life with Humility
Remaining useful life is an estimate of how long an asset can continue meeting its required function before intervention becomes necessary. It is inherently uncertain because load, environment, maintenance quality, and fault progression can change.
For many plants, a practical statement is more useful than a precise-looking number: “The trend is worsening; inspect within the next planned outage and maintain a contingency plan.”
When a numerical estimate is used, communicate its assumptions and uncertainty range. Do not let a forecast encourage continued operation beyond a risk level the organization has not accepted.
🧯 Turn Alerts into a Maintenance Workflow
Condition monitoring creates value only when it changes action. Each alert level should have an owner, expected response time, evidence to collect, and escalation path.
- Verify the measurement and operating state.
- Review trend, spectrum, temperature, and relevant process data.
- Inspect the machine and surrounding installation.
- Assess production, safety, environmental, and repair risks.
- Plan correction, monitor closely, or escalate for controlled shutdown.
Close the loop after the work. Did the vibration return to baseline? Did the temperature response improve? The answer improves future diagnosis and validates the repair.
🚫 Common Mistakes That Create False Confidence
- Comparing unlike conditions: treating readings from different speeds or loads as equivalent.
- Chasing one number: diagnosing a fault from an overall vibration value without spectral or operational context.
- Ignoring installation: assuming every abnormal signal originates inside the machine.
- Over-alarming: setting thresholds so sensitive that personnel learn to ignore them.
- Skipping verification: acting on a bad sensor, poor mounting, or data-entry error.
- Collecting data without ownership: generating reports that never reach the planner or reliability team.
A mature program does not eliminate uncertainty. It makes uncertainty visible and manages it systematically.
🛡️ Safety and Operational Boundaries Still Apply
Condition data should never override established safety procedures, equipment protection systems, or operating limits. A machine with a concerning trend may still require immediate shutdown if there is a credible risk of fire, release, rotating-part failure, or harm to personnel.
Likewise, a normal-looking dashboard is not permission to bypass inspections or safeguards. Sensors only observe selected locations and failure modes.
Decisions should involve the appropriate operations, maintenance, reliability, and safety personnel, especially for critical equipment.
🗺️ A Practical Starting Plan
Start small with a group of assets where failure has meaningful consequences and condition monitoring can influence maintenance timing. Define the likely failure modes and the decision each measurement is intended to support.
- Map each asset’s mechanical and process context.
- Install or standardize measurements at repeatable locations.
- Collect healthy-condition data across normal operating ranges.
- Set reviewable alert bands and response responsibilities.
- Investigate alerts using multiple evidence streams.
- Record findings and use post-repair data to refine the baseline.
This approach is usually more sustainable than instrumenting everything immediately and hoping useful patterns emerge later.
🎯 The Core Principle: Context Turns Signals into Decisions
Vibration reveals how a machine moves. Temperature reveals how it generates and sheds heat. Operating data reveals what demands the process is placing on it. None is a complete diagnosis by itself.
The smarter approach is to ask whether the signals change together in a way that fits a physical failure mechanism. A rising vibration trend during constant load means something different from the same trend appearing only at a new speed or flow condition.
When measurements are reliable, compared under appropriate conditions, and tied to a clear maintenance response, predictive maintenance becomes less about chasing alarms and more about managing machine health deliberately.
The best failure prediction is not a dramatic forecast; it is a well-supported decision made early enough to reduce risk, protect production, and repair the real cause. ⚙️📈🔧