7.1 MEASUREMENT OF QUANTITY OF CRUDE OIL AND PRODUCTS
In a refi nery, crude oil is received in tanks and the stock is evaluated at a particular temperature in volumetric quantity. The price of crude oil is internationally expressed in US dollars per barrel (1 bbl = 42 gallons = 158.9 L). The stock and processing rate is evaluated in volumetric quantity, usually in kilolitres (m3 ). The prices of fuels, e.g., kerosene, diesel, and furnace oil, are rated in volume, while gases and liquifi ed gases, bitumen, lube oil, and wax are rated in weight. Packed products in cylinders or in drums are always rated in weight.
7.1.1 TANK DIPPING
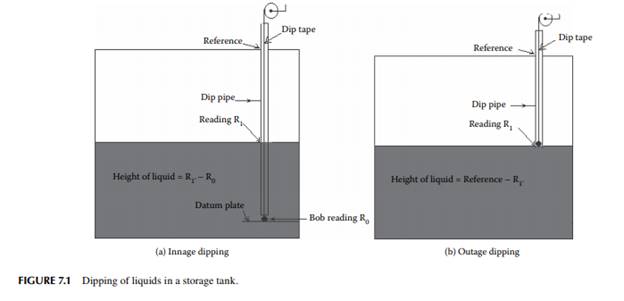
The liquid quantity stored in a tank is commonly measured by a rod, tape, or stick and level measuring instruments. Graduated sticks are used to measure depth of liquid in tanks of short heights. For larger tanks, more than 3 m high, graduated dip tapes are used. These tapes are usually made of steel or brass or aluminium coiled over a wheel and the end of the tape is attached to a metallic ball or bob made of brass or aluminium. For low viscous and non–sticky liquids, a dip tape is lowered into the liquid until it touches the bottom of the tank or the datum plate in the tank. To ensure the correct vertical distance from the top to the bottom, it is essential to check the tape reading against a reference height marked on the tank. The height of the liquid is then read as the difference between the reading of the wetted portion and the bob end. Colour–sensitive pastes are used to mark the beginning of the wetted portion. For example, oil fi nding and water fi nding pastes (two different colour–sensitive dyes that change colour as they contact oil and water, respectively) are used. This type of measurement is known as the innage method of dipping. For sticky and viscous liquids or semi–solid or solid materials, outage dipping is done. In this method, the height of the space above the stock of materials is measured by a tape as lowering of the same will be diffi cult through the liquid. The typical measuring methods for both innage and outage dipping are presented in Figure 7.1. Level measuring instruments, such as fl oat tape, a differential pressure gauge, a displacer level gauge, and electrical level gauges, are also used for measurement and recording in a distant control room. Since measurement of level by these instruments may not be accurate, it is therefore manual dipping, as discussed earlier, that is done for more accuracy over a long period of time, e.g., every day, once in a month or once in a year, where commercial transactions are involved. However, instrument reading is essential for continuous evaluation and recording
7.1.2 VOLUME CORRECTION
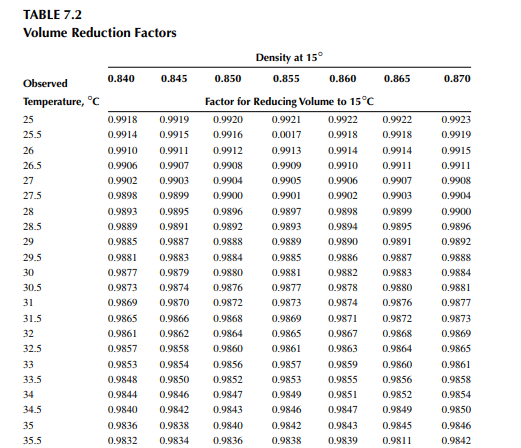
The volume of a liquid increases and decreases with an increase and decrease in temperature. Hence, in the hydrocarbon industry, the volume of liquid is always expressed at a temperature of 15.5°C, which is taken as the standard temperature for measurement. During dipping of liquids in tanks, it is mandatory to measure the temperature of the liquid. For accuracy, a sample that is taken as the equal mixture of top, middle and bottom of the tank must be collected during dipping. This sample is abbreviated as a TMB sample, which is a representative sample of the average of the temperature, density, and composition of the liquid in store. The volume corresponding to the dip of liquid measured is calculated from the tank calibration chart and is reported as the measured average temperature during dipping. Finally, this volume is expressed at 15.5°C with the help of the ASTM volume correction factor, which takes into account the coeffi cient of thermal expansion of the liquid.
7.1.3 DENSITY CORRECTION
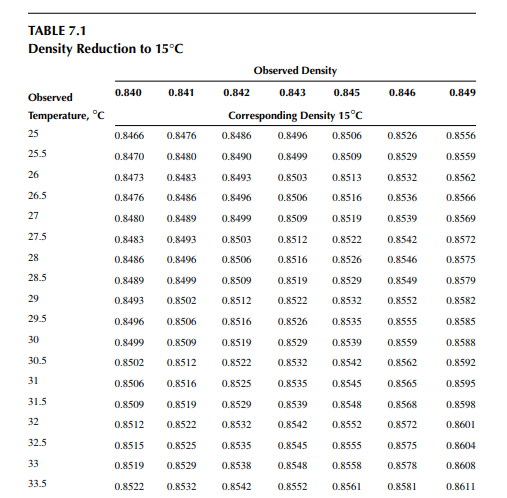
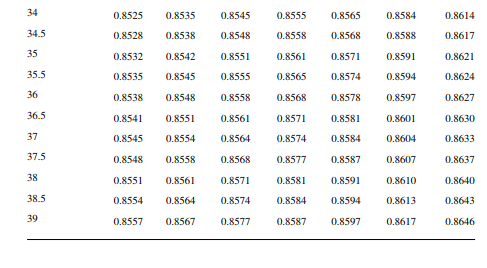
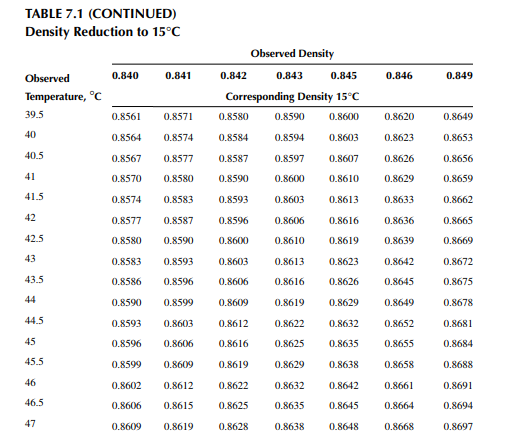
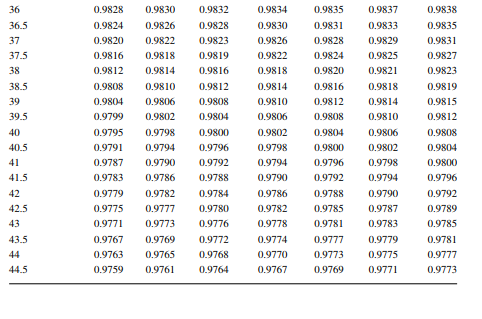
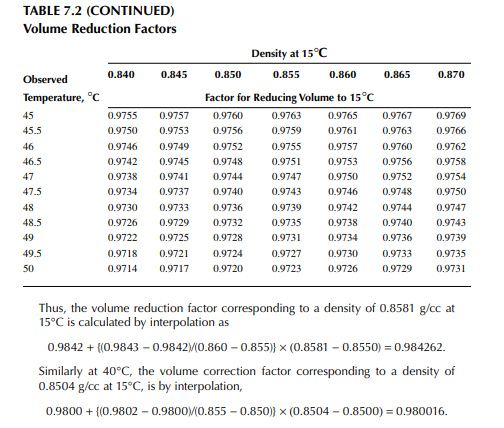
Density is defi ned as the mass per unit of volume, hence the density of a liquid decreases with an increase in temperature and vice versa. Therefore, in order to measure the mass quantity of a liquid, e.g., kilogram or ton, it is necessary to obtain both the volume and density at the same temperature. Since the temperature of the liquid during dipping and the temperature while density is measured will differ, both the volume and density are reported at 15.5°C with the help of the ASTM correction factors. It is convenient to measure the depth of liquid petroleum in a storage (dipping or gauging) tank and the volume is evaluated from a tank calibration chart. Tables 7.1 and 7.2 present the ASTM table of density and volume corrections for oils at various temperatures. The mass of oil received or transferred is then evaluated by multiplying the volume by the density, both at standard temperature. However, the absolute mass of a stock requires correction of the atmospheric pressure different from the pressure at sea level. Accurate evaluation of the quantity of oil received or transferred is very important for the value of the oil stocks sold or received. The following example will be helpful for understanding the method of evaluation of stocks.
Example 7.1
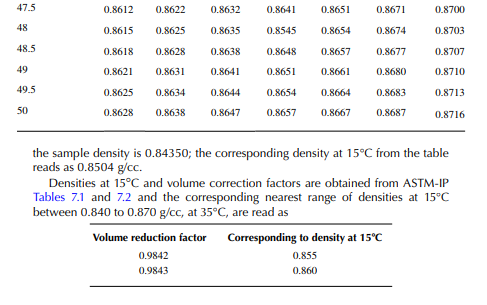
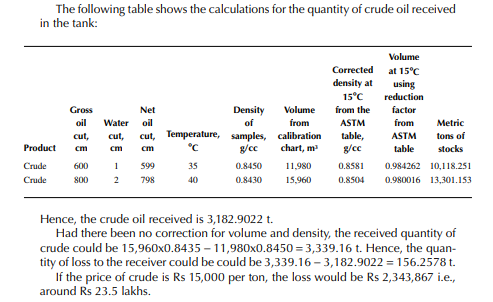
The following data applies for a receiving tank of crude oil. The tank dip before receiving (the opening dip) was 600 cm with a 1-cm water cut at 35°C and after receiving was complete (the closing dip) it was 800 cm with a 2-cm water cut at 40°C. The densities of the opening and closing oil samples were reported to be 0.8488 and 0.8430 g/cc, respectively. Determine the quantity of crude oil in metric ton received in the tank. The tank calibration chart and the ASTM table for density and volume correction factors are used for obtaining tank volume and correction factors, respectively.
Solution
From the density correction table: At 35°C, the sample density is 0.8450; the corresponding density at 15°C from the table reads as 0.8581 g/cc; and at 40°C,
7.2 MEASUREMENT OF GASES IN CLOSED VESSELS
Gases that are easily liquifi ed by pressure at room temperature, such as liquifi ed petroleum gas (LPG), propane, and butane, are stored in cylindrical or spherical pressure vessels. The volume that can be stored in a spherical vessel (Horton sphere) is more than the volume stored in a cylindrical vessel of the same dimensions. The volumes of a sphere and a cylinder are 4/3 Π R3 and Π R3 (where R = H of the cylinder), respectively, i.e., the volume of a sphere is 4/3 times that of a cylinder. Another advantage of using the Horton sphere is the larger surface area (4 Π R2) for cooling compared with the cylindrical vessel of the same dimension (2 Π R2); this is essential for keeping a large amount of liquifi ed gas cooled. The quantity of liquifi ed gases is assessed by the level of the liquid and the volume, which is obtained from the calibration chart of the vessel. In fact, the level is either seen through a gauge glass or by a differential pressure gauge. Since gases are stocked and transacted in mass, volume and density must be used subject to temperature corrections. Gases that are not liquifi ed at room temperature, such as hydrogen, nitrogen, and helium, are quantifi ed by an equation of state based on the measured temperature and pressure in the vessel. Of course, the entire internal volume of the vessel must be obtained from the calibration chart.
7.3 MATERIAL BALANCE IN A PLANT
Usually, material and energy balances are carried out at different frequencies, e.g., daily, weekly, monthly, and yearly. In refi neries, daily material and energy balances are prepared for the previous 24 h (e.g., from 07:00 a.m. of the previous day to 07:00 a.m. of the next day). Various records, such as tank dips of crude oil, liquid and liquifi ed products, meter readings of fuel gas, and electricity and steam consumption, are taken for making such daily balances. Monthly balances, usually at the end of the month, are prepared by similar methods and reconciliation is carried out with the cumulative daily balances. Annual material and energy balances are similarly prepared reconciled, and audited by authorised auditors for the evaluation of annual profi t and loss statement. This is also required for preparing profi t and loss and the balance sheet of the company. There are some statutory obligations for compulsory material and energy balances, whose guidelines are given by the government according to the Companies Act. These are really non-technical topics, but a plant or unit’s material and energy balances are the responsibility of the engineers who prepare these balances based on scientifi c and technical rules. Let us discuss how these balances are prepared.
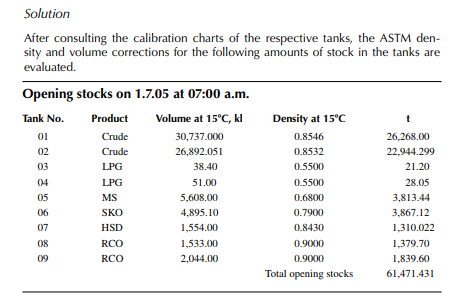
Example 7.2
Consider a refi nery processing crude oil to produce LPG, motor spirit (MS; naphtha inclusive), superior kerosene oil (SKO), high speed diesel (HSD), and atmospheric bottom reduced crude oil (RCO) from the crude distillation unit. Two crude oil tanks, 01 and 02, have been used for feeding the unit during the 24-h operation from 07:00 a.m. the previous day until 07:00 a.m. of the next day. Tank dips are given in the following tables where products were received in the nine tanks (run down tanks) numbers 04−09.
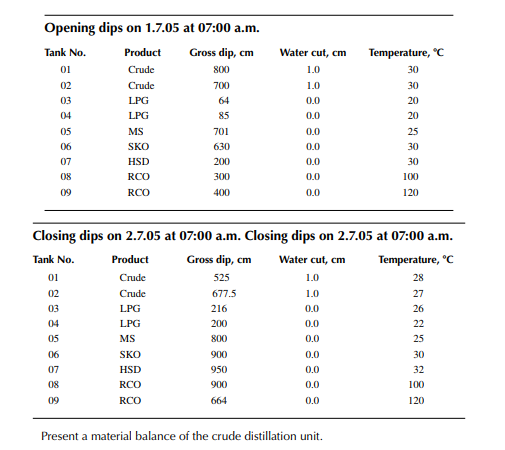
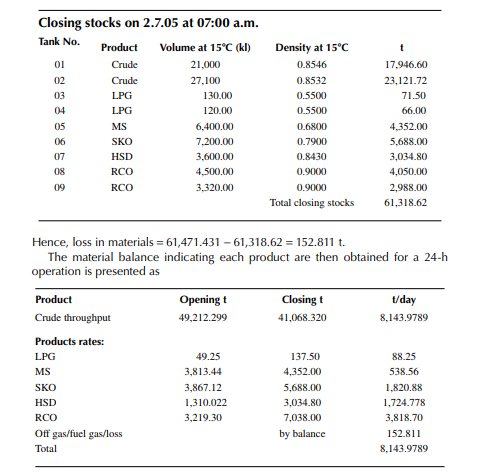
This example shows how stock tables are produced and overall material balance is carried out for losses/off gases. Crude processed and product withdrawal breakup (also known as a pumping sheet) calculated above is also essential for assessing productivity and production targets. Separate material balances as above for each plant must be similarly prepared. Utility material balances, such as water balance, chemical consumption, and steam consumption, are also accounted for proper utilisation of the utilities.
7.3.1 FLOW METER READINGS
In a plant like a refi nery, the units run continuously for 330 days/year and are shut down once a year for about a month for necessary cleaning and maintenance of the pipes, equipment, instruments, etc. During the operation, the fl ow rates of the liquids and gases are continuously monitored and recorded for the necessary material and energy balance required for assessing the quality, quantity, and health of the plant and the equipment. The gas fl ow rates and pressure are measured and controlled through pressure recorder controllers (PRC) and the liquid fl ow rate is measured
in volumetric fl ow rate (FRC) at a constant temperature of 15.5°C. Since the fl ow rates may fl uctuate widely during the operation, the total fl ow of the fl uids for a particular period cannot be easily calculated and must be integrated over the period. Continuous cumulative fl ows, usually in mass fl ow, are recorded by integrators, which indicate the total mass of the fl uids that have passed through over a certain period, i.e., a day, a month, or a year.
7.3.2 FUEL CONSUMPTION
Hydrocarbon gases or liquids or both are consumed as furnace fuels to supply the necessary heat for unit operations and reactions. Flow recorders and integrators are present to monitor and control the fuel consumption in the process furnaces and power plant boilers.
7.3.3 STEAM CONSUMPTION
Steam in various forms, such as low pressure (LP), medium pressure (MP), or high pressure (HP), is used as process steam or heating steam or power steam for steamdriven pumps and compressors. Steam fl ow rates and integrator readings are essential to assess the steam raised, consumed, and returned as condensate. Loss of steam can be calculated by a steam and condensate balance.
7.3.4 OVERALL MATERIAL BALANCE
It is essential to make a material balance of the entire refi nery as well as individual material balances of all the units in the plant, periodically. The overall material balance of the entire refi nery is a balance of the total crude processed and the products formed, while the difference indicates fuel and loss for any period. Similarly, fuel and loss for each unit is also evaluated by the overall material balance of that unit. The following example explains how overall material balance is carried out for any unit.
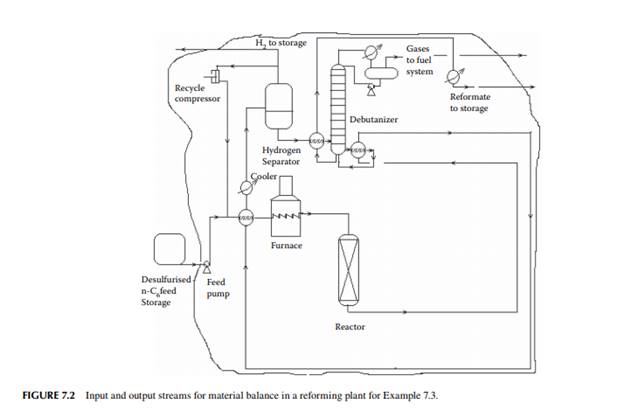
Example 7.3
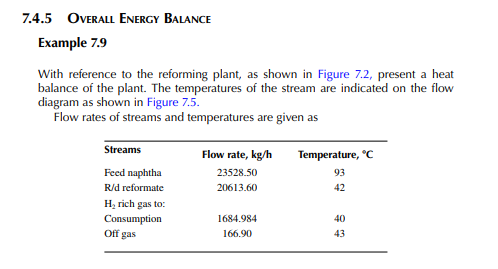
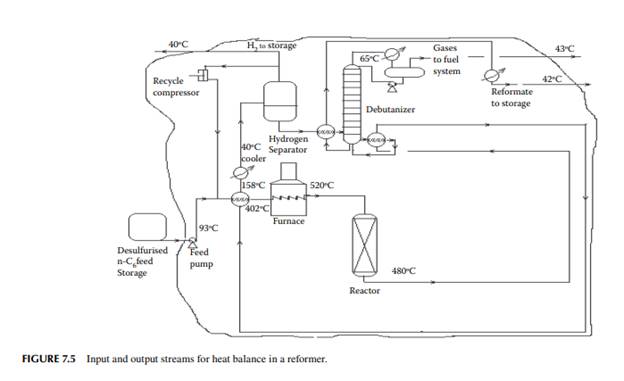
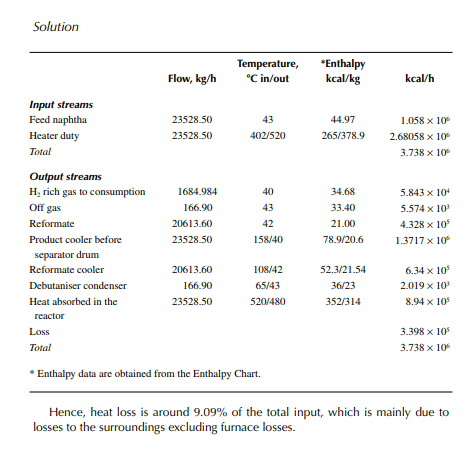
Present a material balance of a naphtha reforming plant as shown in Figure 7.2 (confi rmed ok). From the tank dip data of the naphtha feed and rundown reformate tanks during a test run of a reformer, the fl ow rates of desulfurised naphtha and debutanised reformate were reported to be 23,528.50 and 20,613.60 kg/h, respectively. Flows of hydrogen rich gas to storage (also for consumption in desulfurising units) and off gases from the debutaniser top were metered (integrator) as 1,684.934 and 166.90 kg/h, respectively.
Solution
With reference to the envelope of input/output streams shown in Figure 7.2, material balance is obtained as follows.
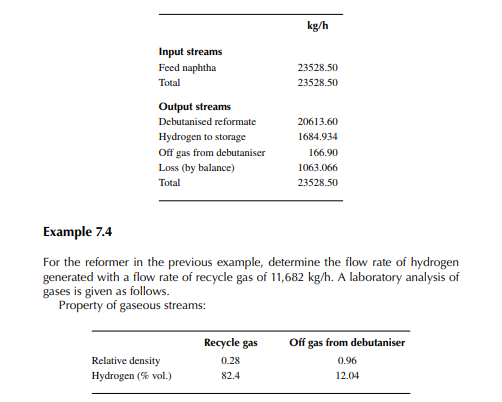
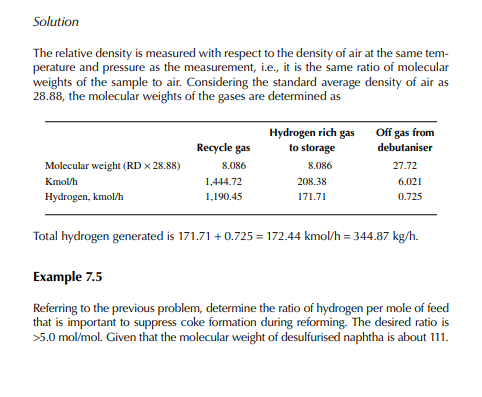
Solution Hydrogen in the recycle gas is 1,190.45 kmol/h and the feed rate is 23,528.50/111 or 211.968 kmol/h. Hence, hydrogen to feed ratio is 1,190.45/211.968 or 5.616 mol/mol.
7.4 ENERGY BALANCE IN A PLANT
Energy in the form of heat and electricity is consumed in a plant. Separate balances must be made to monitor the energy consumption in each plant and its equipment. The sources of heat and power in a plant are fuel and electricity (generated or borrowed from outer sources). Because refi neries and petrochemical plants require huge amounts of power, captive power plants are run using petroleum fuels. Thus, a large amount of fuel is burnt in both the process furnaces meant for each process plant and in the thermal power plant, which meets the plants’ demand for both steam and electricity. The total amount of fuel consumed, utilisation of heat, steam consumption, and electricity consumption for the whole plant per day, per month, and for the year must be assessed.
7.4.1 HEAT BALANCE
Heat is required to raise the temperature of feedstock to the operating temperature of various processes, such as distillation, stripping, extraction, and conversion. A variety of heat transfer equipment, such as heat exchangers, furnaces, and reboilers, are employed in the plant at different temperature ranges. In the heat exchangers, hot and cold fl uids are brought over a common metallic surface to mutually exchange heat between them but without any physical contact or mixing. These types of heat exchangers are called recuperators. Although the majority of heat exchangers fall into this category, there are direct contact heat exchangers, too, where hot fl uid may come in contact with cold fl uid and physically mix up. Most common recuperators are double pipe and shell-and-tube heat exchangers. All these exchangers are discussed in Chapter 8.
7.4.2 ENERGY BALANCE IN A HEAT EXCHANGER
The amount of heat energy transferred from hot to cold fl uid and the heat gained by the cold fl uid from the hot fl uid must be balanced according to the law of conservation of energy. This law is true when an adiabatic condition exists, that is, no heat is lost to the surroundings from the external surface of heat exchanger. In fact, heat is lost through the insulation to the surroundings and, as a result heat gained by cold fl uid is always less than total heat given up the hot fl uid. In the case of hot fl uid fl ow in the shell side, heat is lost from the shell to the surroundings. When, cold fl uid passes through the shell side, heat is lost from the cold fl uid to the surroundings.
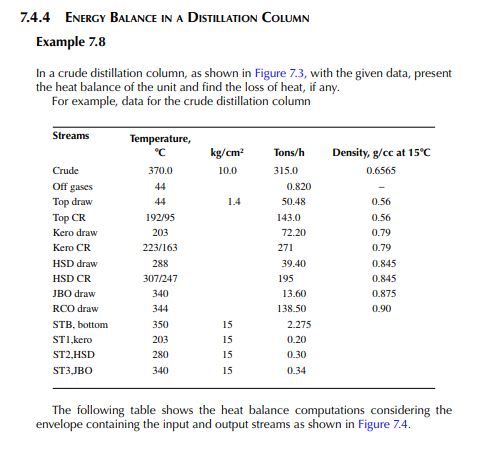
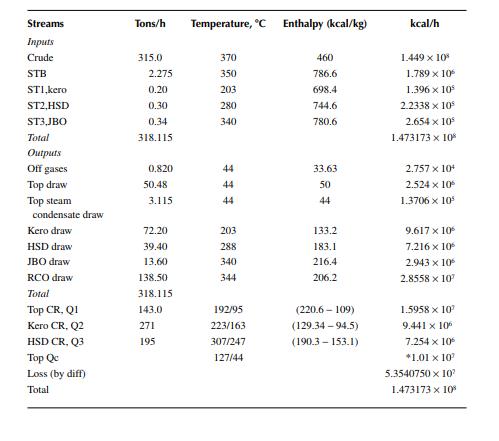
Example 7.6
Make a heat balance in a heat exchanger for preheating crude oil at a rate of 312.5 tons/h from 20°C to 51°C by kerosene at a rate of 92.2 tons/h from 193°C
to 85°C. Take the countercurrent heat exchange for calculation. Given that the density of crude oil and kerosene is 0.6535 and 0.791 g/cc, respectively, at their corresponding average inlet and outlet temperatures. The specifi c heat of crude and kerosene at their average temperatures is 0.52 and 0.53 cal/g °C, respectively. Solution Heat lost by kerosene is mass fl ow rate × specifi c heat × temperature difference between the inlet and outlet, which is 92.2 × 0.53 × (193 − 85) = 5.2775 × 10⁹ cal/h. Heat gained by crude oil is mass fl ow rate × specifi c heat × temperature difference between the outlet and inlet, which is 312.5 × 0.52 × (51 − 20) = 5.0375 × 10⁹ cal/h. Hence, the heat loss from the exchanger to ambient temperature is 5.2775 × 10⁹ − 5.0375 × 109 = 2.40 × 10⁹ cal/h. Effi ciency of heat transfer is 5.0375 × 10⁹/5.2775 × 109 = 95.45%. From such a thermodynamic heat balance, the loss of available heat can be measured and action may be taken. For example, in this case, insulation of the outer wall should be rectifi ed to avoid loss of heat to the surroundings. It is to be remembered that the above heat balance is applicable when there is no phase changes in either of the fl uids, which are, in fact, liquids in this example.
7.4.3 ENERGY BALANCE IN A FURNACE
Tube- or pipe-still furnaces are commonly employed in petroleum refi neries and petrochemical plants. The elements of construction of such furnaces are described in detail in Chapter 8. Gaseous fuel or liquid fuel or both are fi red in the furnace through appropriate burners. Heat generated by the combustion of these fuels is transferred to hydrocarbon vapour or liquid feed through the pipes. The rate of heat transfer is governed by radiation and convection. The total amount of heat transferred to the hydrocarbon feed is much lower than the actual amount of heat generated by combustion of the fuel due to heat losses through the stack exhaust, wall loss, and fouling of the inner and outer surfaces of the pipes. These losses can be accounted for by the heat balance of the furnace. This is explained by the following example.
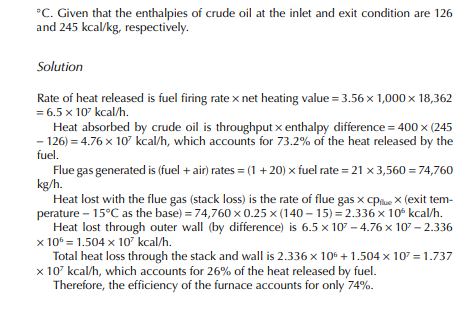
Example 7.7
In a furnace crude oil with a API of 36 is heated from its feed temperature of 260°C−370°C at a rate of 400 tons/h. If the rate of fuel consumption is 3.56 tons/h, present a heat balance of the furnace. Given that the stack gas temperature is 140°C and the ambient air temperature surrounding the furnace is 30°C. The net heating value of fuel is 18,362 kcal/kg and the air to fuel ratio is 20 kg/kg (corresponds to 30% excess air). The specifi c heat of fl ue gas is taken as 0.25 kcal/kg
QUESTIONS
1. Why are material and energy balances essential for a plant?
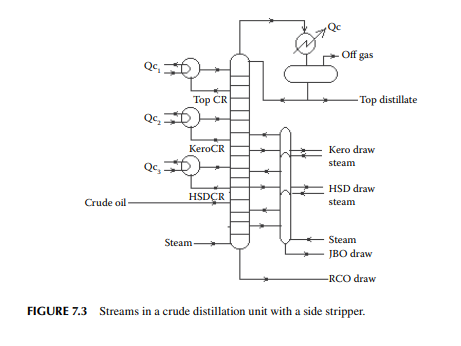
2. What information must be collected for material balance in a crude distillation unit?
3. How will you carry out a survey in a distillation column?
4. What are the various reasons for material losses? 5. Heat loss cannot be avoided 100%, explain?