The body mass is one of highly important indicators of the development of the young cattle, therefore it is essential to follow it up. Only the animals with sufficient body frame and with well muscled top – quality body parts can be successfully fattened to high body mass. To obtain the highest precision in measuring of cattle weight gain, weighing should take place repeatedly in the period prior to slaughter.Methods for assessing growth by the weighing of animals are an important factor in monitoring production capacity of cattle according to their inheritance capacity, food conversion, average daily gain and carcass yield all of which subsequently affect the output of the herd. The most reliable information about the body mass of cattle can be obtained by weighing the animals. Accurate data on the body mass are obtained by weighing with the use of various weighing devices, such as the spring weighing devices or more modern electronic weighing devices. Since in most cases, weighing is done manually the process often needs at least two stockmen, and takes 3 to 5 minutes per bull. In addition, the procedure is stressful for the whole herd, and from an ergonomic point of view, unsatisfactory (Brandl & Jørgensen, 1996).However, the raisers did not have available weighing devices frequently and the animals cannot be often weighed, thus the individual body parts are measured alternatively. Usually, measuring of the whither size suffices, because the body frame, size and length are in positive relation to intensity and capacity of meat production. However, the information acquired is less accurate than the one obtained by the weighing. The differences are affected by the breed type, satiety of the animal, manner of feeding and even tightness of the tape during measuring (Kogel & Utz, 1988). It is also known, as much as the calves deviate from the optimal body development, the establishing of the body mass deviates. Thus, in order to calculate the body mass more accurately, it is necessary to consider also the trunk length in addition to the whither size.In the following chapters the comparison between the manual and automated electronic weighing systems is going to be presented firstly, which clearly shows the most important advantages of the modern systems. Then, the non invasive, indirect weight determination from the dimensions of the animal, measured by an image-processing model will be presented and explained that can be used for automatic and precise estimation of body dimensions from images of live animals and for predicting the body weight of individual cattle.
Manual weighing
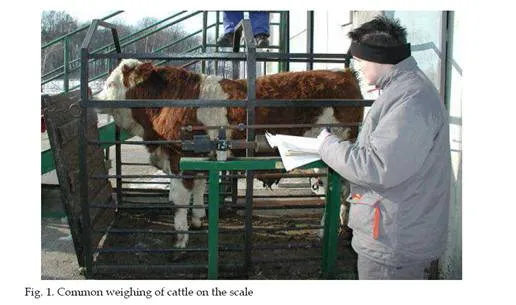
Manual weighing represents the oldest and simplest method for assessing the body mass of live animal, which served for centuries precise enough for commercial use. Nowadays weighing on balance is still important method for measuring the growth of animals and estimating the fodder conversions, because the device is cheap and easy to handle. However, whenever using manual balance in progeny test of bulls sires a farmer must first insure a fattening barn for each manual weighing, where a particular number of animals are placed together into the group boxes. The groups are usually formed according to the body mass so the animals remained together until the end of the growing. Normally a plan of several weighing is scheduled, starting from housing till slaughtering in 60 days interval. For each weighing the animal must be moved from the group box on the weighing device, which is very stressful for the cattle as well as the stablemen. The simplest manual weighing device is shown in Fig. 1, which is calibrated manually once the cattle stand calmly on it. After the balance is set correctly, the stablemen can read the weight.
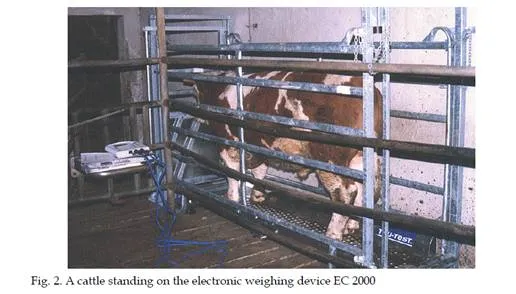
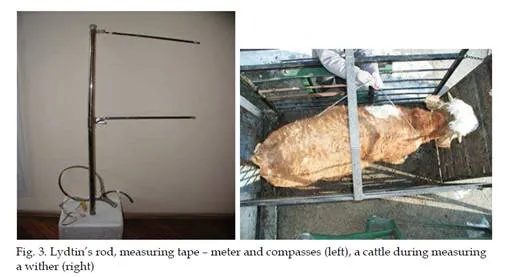
The next generation of balances represents the electronic weighing device, which contrary to manual devices is calibrated automatically and can read the body weight autonomously as well. A sample of automatic electronic device EC 2000 is shown in the Fig. 2. As seen, during the weighing the load bars must be installed under the platform on a firm, level surface and prevent platform movement. Then the load bar cables are connected to the indicator to ensure that they would not be walked on, chewed by animals or squashed in any way.Once the cattle is standing on the weighing scale additional measurements of the trunk, length, the chest size, the withers height and the croup height can be measured as well. The height of the withers, the croup height, the body length, the croup length, the chest width, the haunch width and the chest depth are usually done by means of Lydtin’s rod (Fig. 3). The beginning and the end of certain body dimension are taken by two foldable arms, which can be moved vertically on the rod. However, for measuring of animals the stableman must apply additional devices as the 117 cm long hollow Lydtin’s rod, measuring tape – meter and the compasses (Fig. 3 left). The measuring tape is a 2.00 cm long scale made of linen or metal and serve to measure the chest size. Unfortunately, there are certain differences between the body masses stated by individual authors. The compasses are metallic and ensure measuring of up to 60 cm length (Kräußlich, 1994; Cepon et al., 2006).
Automatic weighing
Automatic weighting systems have been intensively researched for pigs, sheep and poultry, however in cattle production only weighting of dairy cows is reported by Cveticanin & Wendl (2004) and Pastell et al., (2006). Different automatic weighing systems have been intensively researched in cattle as well as dairy production.The sophisticated radio frequency identification system was found to be a highly effective tool for documenting bunk attendance, feeding behaviour and weighing of animals on the scale in cattle production, whenever animals were equipped with two separate RF transponders (Schwartzkopf-Genswein et al., 2002). There is a worldwide movement towards automation in cattle husbandry, with the objective of fully automating every process from feeding to milking. Automatic milking has become a common practice in dairy production and, at the end of the year 2003, about 2200 farms worldwide used a milking robot (Rousing et al., 2004). Milking robots offer a unique possibility for the dynamic measurement of body weight. For example, it is highly probable that hoof problems can easily be noted by separately measuring the load on each leg. Dairy farming is developing into full automated production system in which scientists want to automate every single process from feeding to milking in order to reduce production costs and maximise milk yield. Dynamic weighing of cattle represents an important segment of this system. Weighing in motion without stopping the animal’s movement after it leaves the milking parlour is of interest due to continuity of the milking process and smaller variations of body weight when measured at the same time of the day. The forces to the ground during the cow’s passage are recorded on walk-through weighers (Rousing et al., 2004). Cveticanin & Wendl (2004) designed the fuzzy-logic dynamic weighing system for dairy cows based on a mathematical model for simulating a cow’s walk, which calculates the body weight with an average error of less than 2 %. The simplified two- legged system measures the force to the ground produced by a cow’s feet when the animal is crossing the scale. Depending on walking speed and force, a body weight is calculated and compared with the database.
Pastell et al. (2006) described another automatic weighing system made from four strain gauge balance devices installed in a milking robot. The computer program was able to measure the average weight, the weight variation of each leg and the total weight with 90 % accuracy. From many different models, two might be suggested for monitoring of young sires.
The GrowSafeTM system
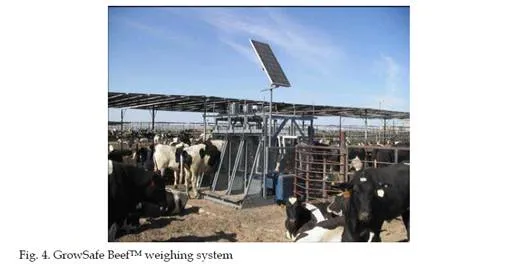
The GrowSafeTM (Fig. 4) system consisted of two antennas, each embedded in a rubberized mat lining the outer wall of the 30 m feedbunks, passive transponders (Texas Instruments Inc., Dallas, TX) encased in plastic ear tags (Allflex, Dallas, TX), a data-logging reader panel connected to the antennae, and a computer to which data were uploaded and analysed (Gibb & McAllister, 1999; Schwartzkopf-Genswein et al., 1999). The antennae emitted a 130 kHz electromagnetic field, and detected the transponders borne by the cattle whenever they came within 50 cm of the feedbunk.This system can identify and record bunk attendance at the bunk of an unlimited number of animals simultaneously. The reader panel logs the presence of each transponder every 6 s for as long as the transponders are within the read range of the antenna. These data can be use to derive the bunk visit frequency and duration. For the purpose of summarizing the transponder data, different meal criterion can be selected. According to Gibb & McAllister (1999) a 300 s meal criterion is most suitable, since it is based on visual observation and validation work carried out by (Schwartzkopf-Genswein et al., 2002) and is the same as that reported by Sowell et al. (1998) for beef cattle. Passive radio transponder data is possible to be collected on all the animals for 24 h per day throughout the growing period. The computer on which the data are storied must be checked every week to ensure that all cells are read when the animals’ transponders are held next to the cell. Every time an animal visits the water trough GrowSafe BeefTM measures weight and drinking behaviour, so the graph can be plotted illustrating the number of visits hourly at each GrowSafe BeefTM drinking position over a three day period
At least two other system similar to the GrowSafe BeefTM system are known from the literature. First, Cveticanin & Wendl (2004) designed the fuzzy-logic dynamic weighting system of dairy cow based on the mathematical model for simulating cow walk, which calculates the body weight with the absolute average error less than 2 %. The simplified two legged system measures the force to the ground when the animal is crossing the scale and generate a curve, which is compared with the database. Pastell et al. (2006) described another automatic weighing system made from four strain gauge balances equipment installed into a milking robot. The computer program was able to measure the average weight, the weight variation of each leg and total weight with 90 % accuracy.
Weight determination using body measurements
Since weighting of older cattle represents a dangerous job for the stableman, the significant correlation between live weight and dimensions of the cattle has led many authors to study the possibility of estimating body weight from the dimensions of the cattle. Heinrichs et al. (1992) indicated that the linear regression of body weight on heart girth had the highest R2, followed by hip width, body length and wither height. Although all measurements are highly correlated, addition of the second body measure contributes a little predictive benefit in the estimation of Holstein heifers’ body weight. Also Wilson et al. (1997) detected the addition of heart girth as a second measurement to the wither height as the most important contribution for estimating the body weight of Holstein veal calves.
Enevoldsen & Kristensen (1997) evaluated the use of wither height, hip height and width to predict the body weight. Seven regression models were developed based on indicators, which are relatively simple to obtain precisely because the anatomical locations are easy to identify. Also Willeke & Dürsch (2002) detected high significant correlation in hip height, heart girth and weight also for the Simmental heifers suggested the third order polynomial equation as the most fitting. The chest size as a basis for the determination of the body mass of living cattle is increased close behind the shoulder-bones. During this measuring the animal must stand with the legs placed parallel and the head should be kept normally (Fig. 1). Each time after the measurement is taken, the body mass is read according to the table. However, it must be kept into account that the determination of the body mass on the basis of the chest size is only approximate.
Determining dimensions by image analysis
Computer-controlled systems for the remote monitoring of livestock have the potential to increase production efficiency and improve animal health and welfare. Examples of potential applications for image analysis based systems in pig husbandry were suggested by Schofeld (2003) and include recording of animal weight, growth rate, quality and conformation, control of diet, monitoring behavioural vices and providing management decision support. Schofeld (1993) describes how remote monitoring systems have the greatest value where continuous observation of intermittent events is essential, and where data collection is tedious and labour intensive, e.g. monitoring weight gain, feeding behaviour and breeding processes including heat detection and farrowing.
A visual image analysis (VIA) system can provide continuous automatic collection of size and shape data in pigs. Thus, it serves as an accurate means of for reflecting pig live mass and for tracking changes in the pig size over time periods that are sufficiently short for commercial use (White et al., 2004).
In order to apply image analysis to the weighing of bulls, the determination of animal body dimensions from images must be possible. Prior to using the image processing, a prediction function was established using the relationship between body dimensions from acquired images and the live weight of the specific cattle breed. Since the image is only a 2-D plain projection of the animal, the loss of one dimension limits the application of such a system to measuring vertical and horizontal dimensions. Therefore, the prediction functions should be precise enough to obtain valid information and can be similar to those described in the previous chapter only when the hip height and wither height are included in the polynomial equations.According to Schaefer & Tong (1998), the thermal expression of warm-blooded animals is highly correlated with various tissue composition characteristics of specific animals, which involve the relative proportions and total quantities of different types of tissue in the animal. Therefore infrared thermal images taken of liveanimals are suggested for detecting and inspecting the body composition noninvasively. Kmet et al. (2000) studied the application of image processing for slaughter value analysis on the basis of three images (above, left and rear) captured from 15-month-old, live Simmental bulls. Live weight was found to be highly correlated with a stepwise linear regression model based on the animal shoulder width, lumbar protuberance in the body width, upper body area and rear thigh area.In the next chapter we are going to present the results of original approach for determining the body dimensions and estimating the body mass of cattle via thermal camera and image analysis developed by Stajnko et al. (2008), which was based on the data collected from May 2006 to June 2008 at the Faculty’s experimental farm in Rogoza.
Image analysis procedure
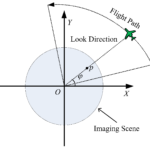
As opposed to common RGB visual techniques, thermography is based on sensing an object’s own heat radiation. This enables evaluation of different characteristics of observed objects with the use of visual cameras. The authors have found few references concerning application of thermal imaging for determining plant parts, counting fruit, vegetable, seedlings or selecting weeds from plants and background. In our experiment the examined cattle were captured from the side by the AGEMA 570 (Flir SystemsTM) thermal camera with an image resolution of 320×240 pixels. The emissivity of the object was set to 0.98 and the temperature resolution was better than 0.5°C, which enables precise detection of body heat in any environmental condition. The measurements were performed using cold concrete wall surroundings, which enabled a temperature difference and therefore a sharp edge between the animal and the background on the capture images.The uncertainty of body edge measurements depends on the image resolution and the position of animal in relation to the camera. Therefore, for holding the distance between the camera and the object constant for all measurements, the animals were guided through a narrow corridor, which also prevented the animal from moving perpendicular to the camera. When the animal was walking through the corridor, we were waiting until it stood in an appropriate position on the image frame. Such procedure was possible because the animals were not aware of being captured by the thermal camera.
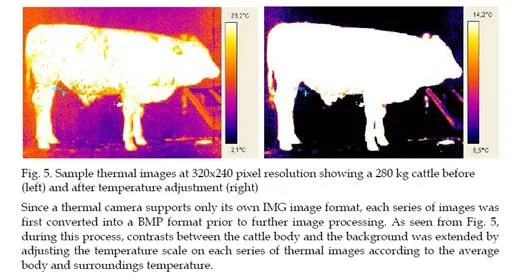
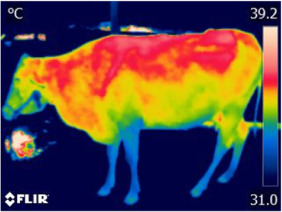
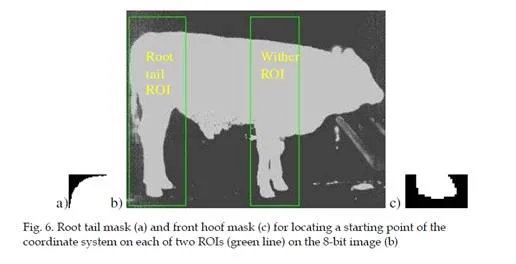
The algorithm for determination of animal’s measures will be illustrated with one sample of a cattle image (Fig. 5), chosen to be representative for demonstrating the results of the procedure. As seen from the BMP image, the thermal camera was able to separate the cattle from the surroundings accurately, so any additional image separation was not required. Prior to every set of measurements a Lydtin’s stick was captured on the image together with the animal. It was applied for the pixel/unit calibration as it ensured enough temperature gradient to the cattle body, which was required for the automatic image processing. Because the thermal image was relatively small for precise measurements, all calculations were conducted on the subpixel level, which increased the accuracy significantly.


Calculating weight
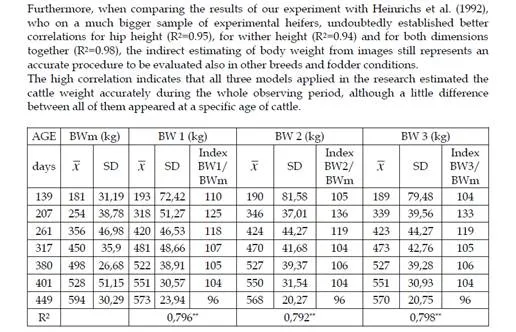
On the basis of the eight-year data set, three models for calculating the cattle weight were developed, which include main body characteristics of each animal of the given Simmental herd. Since, in the period of progeny test all cattle were in fact sons of eight cattle sire lines, the herd was genetically relative unique. Thus, the applied data served excellently for evaluating our group of experimental animals.As already reported by Enevoldsen & Kristensen (1997) and Heinrichs et al. (1992) measurement of heart-girth (chest circumference) was commonly used to estimate dairy heifer body weight from previously derived equations or tables. However, many experiments showed that variability of heart girth measurements depended significantly from the weighing classes (42–590 kg). Thus measured standard deviations can varied from2.19 cm to 2.74 cm within one observer. However, repeatability between two heart-girth measurements by an individual observer on the same animal using a blind heart girth tape was >0.99. additionally correlation coefficients between two measurements by different observers using blind measuring tapes on the same animal also were >0.99, with 99% of total differences due to observer and heifer, indicating very little random variation.Based on previous experiences of Enevoldsen & Kristensen (1997) and Heinrichs et al. (1992) the wither height and the hip height was determined as most significant body dimensions for estimating the cattle body weight also in our experiment with thermal camera and image analysis system. From this reason we choose wither and height measures as most convenient for estimating the cattle live weight. The following three regression models were chosen to be investigated: