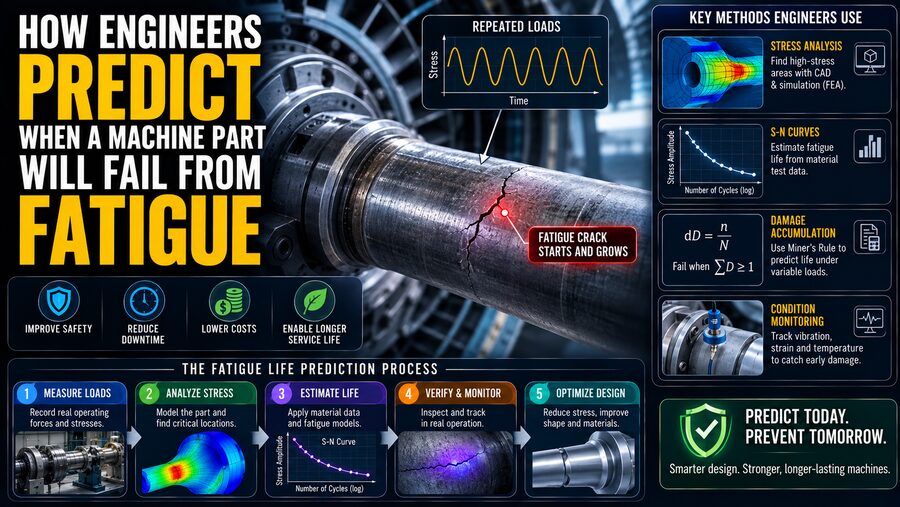

A machine component can fail even when the forces acting on it are far below the load required to break it in a single event. 🔩
That may sound surprising, but it is one of the most important ideas in mechanical engineering.
A rotating shaft, aircraft component, gear tooth, bridge connection, spring, crankshaft, or turbine blade may survive one load easily. It may also survive a thousand repetitions. Yet after millions of repeated loading cycles, a tiny crack can begin to grow until the remaining material can no longer support the load.
This process is called fatigue failure.
Engineers predict fatigue life by combining material testing, stress analysis, statistical models, computer simulation, fracture mechanics, and real-world inspection data. The goal is not simply to ask:
“Is this part strong enough right now?”
Instead, engineers ask:
“How many times can this part experience these stresses before fatigue damage becomes unacceptable?” 📊
That shift—from static strength to repeated loading—is fundamental to designing reliable machines.
🔄 What Is Metal Fatigue?
Fatigue is the progressive damage caused by repeated or fluctuating stresses.
Imagine bending a paper clip slightly back and forth.
One bend does not break it.
But repeated bending eventually creates a crack, and the wire snaps.
Machine components can experience a similar process, although the stresses may be much smaller and the failure may take millions or even billions of cycles.
Examples of cyclic loading include:
- A rotating shaft bending once every revolution
- A gear tooth carrying load every time it meshes
- A spring compressing and extending repeatedly
- An aircraft wing flexing during every flight
- A turbine blade experiencing changing aerodynamic forces
- A vehicle suspension arm responding to bumps
Fatigue is especially important because failure can sometimes occur with little visible deformation beforehand.
🧠 Why Repeated Stress Causes Damage
Metals are made from microscopic crystal structures.
Even a carefully manufactured part contains tiny imperfections, such as:
- Surface scratches
- Material inclusions
- Microscopic voids
- Machining marks
- Grain boundaries
When a part is repeatedly loaded, some locations experience slightly higher stress than others.
Over many cycles, microscopic plastic deformation can accumulate.
Eventually, a tiny fatigue crack forms.
The crack then grows a little during repeated loading.
A simplified fatigue process is:
Cyclic stress → Crack initiation → Crack growth → Final fracture
The final break may occur suddenly, but the damage may have been developing for a very long time.
📍 Stress Concentrations Are Especially Important
Fatigue cracks often begin where stress is concentrated.
A smooth bar distributes load relatively evenly.
But geometric features such as:
- Holes
- Sharp corners
- Threads
- Keyways
- Weld toes
- Grooves
- Sudden changes in diameter
can create local regions of much higher stress.
This is called a stress concentration.
For example, the average stress in a shaft may be moderate, while the stress around a sharp keyway is significantly higher.
Fatigue cracks are therefore often found near geometric discontinuities.
Engineers reduce these effects using:
- Rounded fillets
- Smooth transitions
- Better surface finishes
- Optimized geometry
Small design details can have a major impact on fatigue life. 🔍
📈 Engineers Measure Fatigue With S-N Curves
One of the traditional tools for predicting fatigue is the S-N curve.
The letters represent:
S = Stress amplitude
N = Number of cycles to failure
To create an S-N curve, engineers test many specimens of a material.
One specimen might experience a relatively high repeated stress and fail after:
10,000 cycles
Another might experience a lower stress and survive:
1,000,000 cycles
Another may survive much longer at an even lower stress.
These test results are plotted to show the relationship between cyclic stress and expected fatigue life.
In general:
Higher stress → Shorter fatigue life
Lower stress → Longer fatigue life
This relationship is one of the foundations of fatigue design.
♾️ What Is the Endurance Limit?
Some steels exhibit a useful behavior called an endurance limit.
Below a certain cyclic stress level, laboratory specimens may survive extremely large numbers of cycles without conventional fatigue failure.
This does not mean every real steel component below that stress is automatically safe forever.
Real parts are affected by:
- Surface condition
- Corrosion
- Temperature
- Manufacturing quality
- Size
- Stress concentrations
Many nonferrous metals, including many aluminum alloys, do not show the same clear endurance-limit behavior.
For those materials, engineers often specify fatigue strength at a particular number of cycles instead.
🔁 Mean Stress Changes Fatigue Life
Repeated loading is not always a perfectly symmetric cycle.
Consider a rotating component whose stress varies between:
20 MPa and 100 MPa
The stress never becomes negative.
Another component may alternate between:
-60 MPa and +60 MPa
Both have changing stress, but their average—or mean stress—is different.
Tensile mean stress can often reduce fatigue life because the material is already being pulled before the alternating load is added.
Engineers account for this using models such as:
- Goodman relationships
- Gerber relationships
- Soderberg criteria
These methods help translate combinations of mean and alternating stress into safe design limits.
🧮 Engineers First Calculate the Stress History
Before estimating fatigue life, engineers need to know what loads the component actually experiences.
They may analyze:
- Forces
- Torques
- Bending moments
- Pressure
- Temperature
- Vibration
- Centrifugal loads
For a rotating shaft, for example, engineers might determine how bending stress changes during every revolution.
For a suspension component, they may use measured road loads.
The result is a stress-time history showing how stress varies.
Fatigue prediction depends not only on the maximum stress but also on:
- Stress range
- Frequency
- Number of repetitions
- Load sequence
💻 Finite Element Analysis Finds Critical Stress Locations
Real components often have complicated shapes.
Hand calculations may not capture local stress around features such as fillets, holes, or welds.
Engineers therefore use Finite Element Analysis, or FEA. 💻
In FEA, a digital model of the component is divided into many small elements.
The software calculates stress throughout the part.
The engineer can then identify areas where cyclic stress is highest.
For example, an FEA result may reveal that:
- Most of a bracket experiences 70 MPa
- A corner near a bolt hole reaches 180 MPa
That high-stress region becomes a likely fatigue-critical location.
🚗 Real Machines Experience Variable Loads
Laboratory fatigue tests often use constant-amplitude loading.
Real machines rarely behave so neatly.
A vehicle may experience:
- Smooth highway driving
- Sharp potholes
- Heavy braking
- Cornering
- Occasional overloads
A wind turbine blade sees constantly changing wind.
An aircraft experiences different loads during taxiing, takeoff, turbulence, cruising, and landing.
Engineers therefore need methods for handling variable-amplitude loading.
🔢 Rainflow Counting Converts Complex Loads Into Cycles
A complicated stress history may look like an irregular series of peaks and valleys.
To perform fatigue calculations, engineers often convert that history into a collection of equivalent stress cycles.
One widely used method is called rainflow counting.
It identifies cycles of different amplitudes from a complex load record.
The result may look like:
10,000 cycles at low stress
2,000 cycles at medium stress
50 cycles at high stress
This cycle distribution can then be used in cumulative fatigue calculations.
➕ Miner’s Rule Estimates Cumulative Damage
A common engineering approximation for variable-amplitude fatigue is Miner’s rule.
Suppose testing indicates that a component would fail after:
N₁ cycles at stress level 1
If the actual component experiences:
n₁ cycles at that level
then the approximate fatigue damage fraction is:
n₁ / N₁
For several stress levels, damage is accumulated:
D = n₁/N₁ + n₂/N₂ + n₃/N₃ + …
When the cumulative damage approaches a specified failure criterion—often conceptually near 1—the predicted fatigue life has been consumed.
Miner’s rule is useful and widely applied, but it is an approximation.
Real fatigue damage can depend on load sequence and other effects that simple linear accumulation does not fully capture.
🔍 Crack Initiation and Crack Growth Are Different Problems
Fatigue analysis can be divided into two broad stages.
1. Crack Initiation
How long does it take before a detectable fatigue crack develops?
2. Crack Propagation
Once the crack exists, how quickly will it grow?
Traditional S-N methods are especially useful for estimating total fatigue life when a component begins essentially crack-free.
Fracture mechanics focuses more directly on components containing known or assumed cracks.
📏 Fracture Mechanics Tracks Crack Growth
Once a fatigue crack exists, engineers can predict its growth using fracture mechanics.
A crack causes stress to become highly concentrated near its tip.
The intensity of this local stress field is described using a quantity called the stress intensity factor, commonly represented by K.
During cyclic loading, engineers examine the change:
ΔK
As the crack gets longer, the stress intensity can increase.
That often causes the crack to grow faster.
Eventually, the crack may reach a critical size at which sudden fracture becomes possible.
📈 Paris’ Law Describes Part of Fatigue Crack Growth
A classic crack-growth relationship is Paris’ law.
In simplified form:
da/dN = C(ΔK)^m
where:
- a is crack length,
- N is load cycles,
- ΔK is the cyclic stress-intensity range,
- C and m are material-dependent constants.
The equation estimates how much a crack grows during each cycle within an applicable crack-growth regime.
Engineers can integrate this relationship to estimate how many cycles it takes for a crack to grow from an initial size to a critical size.
This is extremely useful in damage-tolerant design. 🔬
✈️ Aircraft Use Damage-Tolerance Concepts
Aircraft structures are a classic example of fatigue-critical engineering.
Each flight produces pressure and structural load cycles.
Over thousands of flights, tiny cracks can potentially develop.
Modern aircraft design does not rely only on the assumption that cracks never exist.
Instead, engineers may use damage-tolerance principles.
They ask:
If a small crack is present, how quickly will it grow?
Then inspection intervals can be chosen so the crack should be detected well before it becomes dangerous.
This creates a layered strategy:
Design → Predict crack growth → Inspect → Repair if needed
🔧 Surface Finish Has a Major Effect
Fatigue cracks frequently begin at surfaces.
Therefore, surface condition strongly influences fatigue strength.
A polished surface generally performs better than a rough-machined surface under otherwise similar conditions.
Scratches can act as microscopic stress concentrations.
Engineers may improve fatigue performance through:
- Polishing
- Grinding
- Better machining
- Controlled finishing
The required finish depends on the application and cost.
🔨 Shot Peening Can Increase Fatigue Life
A fascinating fatigue-improvement technique is shot peening.
Small spherical particles strike the metal surface at controlled speed.
This plastically deforms a very thin surface layer.
The process creates beneficial compressive residual stresses near the surface.
Why does that help?
Fatigue cracks generally open more easily under tensile stress.
A compressive surface stress makes crack initiation and opening more difficult.
Shot peening is widely used on components such as:
- Gears
- Springs
- Aircraft parts
🔥 Heat Treatment Changes Fatigue Properties
Material strength and microstructure depend strongly on heat treatment.
Processes such as:
- Quenching
- Tempering
- Carburizing
- Nitriding
can change hardness, strength, residual stress, and fatigue behavior.
Gears, for example, may require a hard wear-resistant surface combined with a tougher interior.
Material processing is therefore part of fatigue design, not simply a manufacturing detail.
🔩 Bolted Joints Require Careful Fatigue Design
Bolts can experience fatigue when joint loads fluctuate.
Properly preloaded bolts often perform better because a large initial clamping force changes how external load is shared.
If a joint becomes loose, the bolt may experience much larger stress fluctuations.
This can dramatically reduce fatigue life.
Engineers therefore consider:
- Bolt preload
- Thread geometry
- Joint stiffness
- Surface condition
- Tightening method
Maintenance procedures such as proper torque control can directly affect fatigue reliability.
🔥 Welds Are Common Fatigue-Critical Locations
Welded structures require special fatigue treatment.
A weld can contain:
- Geometric discontinuities
- Residual stresses
- Local imperfections
The weld toe—the transition between the weld and base material—is a common crack-initiation site.
Engineers often assess welded fatigue using standardized detail categories based on weld geometry and loading rather than relying only on the smooth-material fatigue strength.
Improved weld profiles, inspection, and post-processing can increase fatigue resistance.
🌊 Corrosion Can Accelerate Fatigue
Fatigue becomes more severe when combined with corrosion.
This phenomenon is called corrosion fatigue.
A corrosive environment can damage the metal surface and create pits.
Those pits act as stress concentrators.
Therefore, a component exposed to:
- Seawater
- Chemicals
- Humidity
- Road salt
may have significantly lower fatigue life than the same component in a clean laboratory environment.
Engineers may use:
- Protective coatings
- Corrosion-resistant alloys
- Cathodic protection
- Environmental sealing
to reduce this risk.
🌡️ Temperature Also Matters
Machines may operate at very high or low temperatures.
Temperature can change:
- Material strength
- Elastic properties
- Crack-growth behavior
- Oxidation rates
At high temperature, engineers may also need to consider creep-fatigue interaction, where time-dependent material deformation combines with cyclic loading.
This is important in systems such as:
- Gas turbines
- Power plants
- Engines
🎵 Vibration Can Create Millions of Cycles Quickly
A component does not need large motion to accumulate huge numbers of fatigue cycles.
Suppose a machine vibrates at:
100 cycles per second
That is:
6,000 cycles per minute
and:
360,000 cycles per hour
A component operating continuously could accumulate millions of cycles very quickly.
This is why vibration analysis and fatigue analysis are often closely connected.
Resonance can make the problem even worse by greatly increasing cyclic stress.
⚙️ Rotating Shafts Are Classic Fatigue Components
Imagine a shaft carrying a gear.
The gear applies a downward force.
As the shaft rotates, a point on the shaft surface moves from:
Tension → Neutral → Compression → Neutral → Tension
Every revolution creates one bending stress cycle.
At 3,000 revolutions per minute:
3,000 cycles occur every minute
A shaft operating for thousands of hours can therefore experience hundreds of millions of cycles.
Engineers must design it for this repeated loading, not merely for the maximum instantaneous force.
🧪 Material Fatigue Data Comes From Testing
Fatigue behavior is difficult to predict from tensile strength alone.
Engineers therefore test materials using specialized machines.
A fatigue-testing machine may repeatedly:
- Bend
- Pull
- Compress
- Twist
a specimen until failure.
Researchers record:
- Stress amplitude
- Mean stress
- Cycles to failure
- Crack-growth rate
Many specimens are required because fatigue life naturally shows statistical variation.
Two apparently identical specimens may fail at different cycle counts.
📊 Fatigue Is Statistical
Fatigue life is not perfectly deterministic.
Microscopic material differences cause variation.
One specimen might fail after 900,000 cycles.
Another nominally identical specimen could survive 1.3 million cycles.
Engineers therefore use statistical methods and design margins.
For critical equipment, they may design for a low probability of failure rather than simply the average laboratory life.
Reliability requirements vary with consequences.
Failure of a decorative cover is not treated the same way as failure of an aircraft structural component.
🛡️ Safety Factors Provide Engineering Margin
Uncertainty exists in:
- Material properties
- Loads
- Manufacturing
- Environment
- Analysis models
Engineers therefore use safety factors or design factors.
A part may be designed so expected operational stress remains comfortably below an allowable fatigue level.
The appropriate margin depends on:
- Consequences of failure
- Confidence in load data
- Inspection possibilities
- Material variability
- Regulations
Safety factors are not substitutes for good analysis, but they provide an important layer of protection.
🔍 Nondestructive Testing Finds Fatigue Cracks
Once a machine enters service, engineers can inspect it for developing cracks without destroying the component.
This is called nondestructive testing, or NDT.
Common techniques include:
👁️ Visual Inspection
Useful for obvious surface cracks or deformation.
🧲 Magnetic Particle Inspection
Can reveal surface and near-surface cracks in ferromagnetic materials.
🎨 Dye Penetrant Inspection
Colored or fluorescent liquid penetrates surface-breaking cracks.
🔊 Ultrasonic Testing
Sound waves can detect internal defects.
☢️ Radiographic Inspection
X-rays or similar radiation can reveal certain internal discontinuities.
The appropriate method depends on the material, geometry, and expected crack location.
📡 Condition Monitoring Can Detect Trouble While a Machine Runs
Some machinery is monitored continuously.
Sensors can measure:
- Vibration
- Acoustic emissions
- Temperature
- Strain
- Shaft movement
A fatigue crack can change a component’s stiffness or vibration characteristics.
For example, a growing crack in a rotating shaft may create new vibration signatures.
Condition-monitoring systems can flag unusual behavior before catastrophic failure.
This is especially important for expensive equipment such as turbines and generators.
🧠 Digital Twins Can Update Fatigue Predictions
Modern engineering increasingly uses digital twins.
A digital twin is a computational representation of a physical asset that is updated using real operating data.
Suppose a wind turbine was originally designed for a predicted loading spectrum.
During service, sensors record actual wind and structural loads.
The digital model can use those measurements to update estimated fatigue consumption.
Instead of relying only on:
Predicted design usage
engineers can estimate:
Actual accumulated damage
This may improve maintenance planning.
🔧 Predictive Maintenance Uses Remaining Useful Life
Engineers often want to estimate remaining useful life, or RUL.
Instead of asking whether the machine is currently working, they ask:
How much fatigue life is probably left?
The answer may combine:
- Original fatigue calculations
- Operating hours
- Measured loads
- Inspection findings
- Crack-growth models
Maintenance can then be scheduled before the predicted risk becomes too high.
This approach is known as predictive maintenance.
🗓️ Inspection Intervals Are Engineering Decisions
Inspection too frequently wastes time and money.
Inspection too rarely may allow a dangerous crack to grow undetected.
Engineers therefore design inspection intervals using estimated fatigue and crack-growth rates.
Suppose analysis predicts that a detectable crack requires about 20,000 cycles to grow to a critical size.
An inspection interval might be chosen substantially shorter than this growth period, providing multiple opportunities to detect the crack.
For safety-critical systems, inspection planning is a major part of the engineering design.
🔍 Fracture Surfaces Can Reveal Fatigue
After a fatigue failure occurs, engineers can examine the broken surface.
Certain features may indicate progressive crack growth.
Fatigue fractures can sometimes show:
- A smooth crack-initiation region
- Progressive growth markings
- A final rough overload region
Microscopic features known as striations may sometimes reveal incremental crack advancement.
Larger visible patterns can also form under changing loads.
Failure analysis helps engineers determine:
- Where the crack started
- Why it started
- How it grew
This information can prevent similar failures in future designs.
🧩 A Simplified Fatigue-Life Prediction Example
Imagine engineers are designing a rotating steel shaft.
The process might look like this:
1. Determine operating loads. ⚙️
Calculate torque, bending, and speed.
2. Perform stress analysis. 📐
Find the highest cyclic stresses, particularly around shoulders and keyways.
3. Account for stress concentrations. 🔍
Adjust local stress estimates.
4. Obtain material fatigue data. 📊
Use appropriate S-N information.
5. Correct for real-world effects.
Include surface finish, size, temperature, mean stress, and environment.
6. Estimate cycles to failure.
Compare operating stresses with fatigue curves.
7. Convert cycles into operating life. ⏱️
If the shaft sees one cycle per revolution, machine speed determines how quickly cycles accumulate.
8. Apply appropriate design margin. 🛡️
9. Validate with testing where necessary. 🧪
10. Monitor or inspect in service for critical applications.
Fatigue prediction is therefore a chain of engineering decisions rather than one simple formula.
⚠️ Why Fatigue Predictions Are Never Perfect
Real machines are complicated.
A prediction can be affected by uncertainty in:
- Actual loads
- Material defects
- Assembly conditions
- Residual stresses
- Corrosion
- Manufacturing tolerances
Unexpected events such as overloads can also change crack-growth behavior.
For this reason, safety-critical engineering rarely relies on fatigue calculation alone.
Design analysis is combined with:
Testing + Inspection + Monitoring + Maintenance
The objective is to create multiple opportunities to identify a problem before failure.
🏎️ Motorsport and Fatigue Life
High-performance racing components provide an interesting example.
A part may be designed to be extremely light and strong but not necessarily intended to last for decades.
Engineers may know that a particular component has a controlled service life.
After a specified number of hours or events, it is replaced even if it still looks normal.
This is called life-limited operation.
The same philosophy appears in aviation and other safety-critical industries.
🏭 Industrial Machines May Prioritize Long Life
Industrial equipment often has different objectives.
A factory gearbox may be expected to operate for tens of thousands of hours.
Engineers may intentionally keep cyclic stresses low so gears and shafts achieve very long fatigue lives.
The design is optimized around:
- Reliability
- Maintenance intervals
- Downtime cost
- Manufacturing cost
Fatigue engineering always reflects the intended service environment.
🔄 Designing Against Fatigue Is About Managing Cycles
One of the most useful ways to think about fatigue is:
Every significant stress cycle consumes some portion of structural life.
A few unusually severe cycles may consume much more life than thousands of gentle ones.
That is why engineers care about the complete load history.
Reducing a peak stress slightly can sometimes increase fatigue life dramatically.
This makes fatigue optimization particularly powerful.
🛠️ Engineers Can Improve Fatigue Life in Many Ways
If analysis predicts insufficient fatigue life, engineers have several options.
They may:
- Increase the component’s cross-section
- Reduce stress concentrations
- Add smoother fillets
- Improve surface finish
- Select a different material
- Use beneficial heat treatment
- Apply shot peening
- Reduce vibration
- Lower operating loads
- Improve corrosion protection
The best solution depends on cost, weight, space, and manufacturing constraints.
✅ Final Thoughts
Engineers predict when a machine part will fail from fatigue by studying not only how large the load is, but how often that load is repeated. ⚙️🔁
Fatigue usually begins with microscopic damage at a highly stressed location. A tiny crack forms, grows gradually under repeated loading, and can eventually become large enough for sudden fracture.
To estimate this process, engineers use S-N curves, mean-stress corrections, variable-load cycle counting, cumulative-damage models, finite element analysis, fracture mechanics, and crack-growth equations.
They also account for real-world factors such as:
- Surface finish
- Stress concentrations
- Welding
- Corrosion
- Temperature
- Manufacturing variation
- Residual stress
For critical machinery, prediction continues after the component enters service.
Sensors track actual loads and vibration. Nondestructive inspection searches for cracks. Digital models estimate remaining useful life. Maintenance intervals are chosen so problems can be discovered before they become dangerous. 🔍🛡️
The most important lesson is that a machine part does not need to be overloaded once to fail.
A much smaller load repeated enough times can gradually consume its structural life.
That is why fatigue engineering is fundamentally about time, repetition, microscopic cracks, and accumulated damage.
By understanding those processes, engineers can design machines that survive millions—or even billions—of load cycles while identifying and replacing critical components long before a tiny invisible crack becomes a catastrophic failure. 🔩📊✨