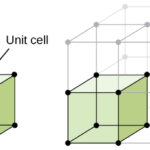
The lattice points in a cubic unit cell can be described in terms of a three-dimensional graph. Because all three cell-edge lengths are the same in a cubic unit cell, it doesn’t matter what orientation is used for the a, b, and c axes. For the sake of argument, we’ll define the a axis as the vertical axis of our coordinate system, as shown in the figure below.
The b axis will then describe movement across the front of the unit cell, and the c axis will represent movement toward the back of the unit cell. Furthermore, we’ll arbitrarily define the bottom left corner of the unit cell as the origin (0,0,0). The coordinates 1,0,0 indicate a lattice point that is one cell-edge length away from the origin along the a axis. Similarly, 0,1,0 and 0,0,1 represent lattice points that are displaced by one cell-edge length from the origin along the b and c axes, respectively.
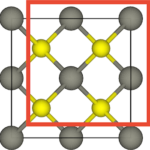
Thinking about the unit cell as a three-dimensional graph allows us to describe the structure of a crystal with a remarkably small amount of information. We can specify the structure of cesium chloride, for example, with only four pieces of information.
- CsCl crystallizes in a cubic unit cell.
- The length of the unit cell edge is 0.4123 nm.
- There is a Cl– ion at the coordinates 0,0,0.
- There is a Cs+ ion at the coordinates 1/2,1/2,1/2.
Because the cell edge must connect equivalent lattice points, the presence of a Cl– ion at one corner of the unit cell (0,0,0) implies the presence of a Cl– ion at every corner of the cell. The coordinates 1/2,1/2,1/2 describe a lattice point at the center of the cell. Because there is no other point in the unit cell that is one cell-edge length away from these coordinates, this is the only Cs+ ion in the cell. CsCl is therefore a simple cubic unit cell of Cl– ions with a Cs+ in the center of the body of the cell.