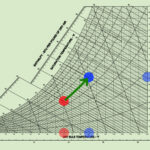
The Psychrometric Chart provides a graphic relationship of the state or condition of the air at any particular time. It displays the properties of air: dry bulb temperature (vertical lines), wet bulb temperature (lines sloping gently downward to the right), dew point temperature (horizontal lines), and relative humidity (the curves on the chart). Given any two of these properties, the other two can be determined using the chart. The chart’s usefulness lies beyond the mere representation of these elementary properties –it also describes the air’s moisture content (far right scale), energy content (outer diagonal scale on upper left), specific volume (lines sloping sharply downward to the right), and more.

Uses of Psychrometric Chart
The psychrometric chart conveys an amazing amount of information about air. It provides an invaluable aid in illustrating and diagnosing environmental problems such as why heated air can hold more moisture, and conversely, how allowing moist air to cool will result in condensation. To predict whether or not moisture condensation will occur on a given surface you need three pieces of information; the temperature of the air, the relative humidity of the air, and the surface temperature. The psychrometric chart explains that by raising the surface temperature or by lowering the moisture content of the air or employ some combination of both can avoid surface condensation. A rule of thumb is that, a 10°F rise in air temperature can decrease relative humidity 20 percent. Use of a psychrometric chart will show that this is true.
A psychrometric chart also helps in calculating and analyzing the work and energy transfer of various air-conditioning processes. In practical applications, the most common psychrometric analysis made by HVAC contractors involves measuring the dry and wet bulb temperatures of air entering and leaving a cooling coil. If these temperatures are known along with the volumetric air flow rate (CFM) through the coil, the cooling capacity of a unit can be verified. Using the dry and wet bulb temperature information, two points can be located on a psych chart and the corresponding enthalpy values read for them. The total BTUH cooling capacity can then be determined by multiplying 4.5 times the CFM value times the enthalpy difference of the two air state points [i.e. 4.5 * CFM * ∆h]. Contractors often have to perform this calculation to prove that their equipment is working satisfactorily.