15.1 COST OF EQUIPMENT
The cost of equipment may be obtained in two ways: (a) by estimation and (b) the purchased price. Cost estimation is required when the equipment is fabricated. Estimated cost will include the material, labour, and the overhead components involved in manufacturing. Material cost will include the direct and indirect components. Direct cost will include the cost or price of the materials, e.g., plates, tubes, rods, beams, etc., which can be identifi ed with the equipment. Indirect materials will include the cost or price of those materials that cannot be identifi ed with the equipment, rather for large number of pieces of equipment manufactured, e.g., the costs of nuts, bolts, screws, welding, threading materials, etc. These are, in fact, required for fabrication of a number of pieces of equipment and cost is apportioned by dividing the total cost of these materials by the number of pieces of equipment manufactured. The labour cost, too, involves direct and indirect elements. For example, the labour involved in fabricating a particular piece of equipment is a direct labour cost, but the cost of labour involved in loading, transporting, welding, threading, lifting, rigging, etc., are indirect labour costs, as these are involved for a number of equipment manufactured. Additional costs, e.g., power, steam, chemicals, etc., which are also identifi ed for a single piece of equipment are the other direct costs and those that cannot be identifi ed as indirect costs or expenses. All these indirect costs are summarily taken as the overhead cost. The sum of direct costs is called prime costs and the sum of the indirect costs is called overhead costs. Thus, the estimated cost of any equipment = [direct material + direct labour + direct expenses] + [indirect material + labour + expenses] = prime costs + overhead cost. This method is used while new equipment is manufactured.
15.1.1 CAPACITY RATIO METHOD
The cost of any equipment can also be obtained by a short-cut method using a capacity ratio based on the known value of the equipment at a given capacity. This is defi ned as
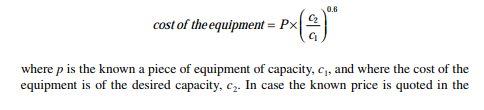
past, the present price may be obtained by multiplying the ratio of the cost index of the present price to the past price. Thus, the estimated cost of the equipment is more accurately obtained by multiplying the cost index ratio.
15.1.2 PURCHASED PRICE
The price paid for purchasing equipment is the cost of the equipment. Sometimes, the cost of installation of the equipment is also included with the purchase price, which is the installed price of the equipment.
15.1.3 FIRST COST OF THE EQUIPMENT
This is the price or cost of the new equipment installed in the plant.
15.1.4 DEPRECIATION
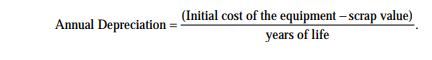
This is an expenditure considered to be a loss of the value of the equipment with time and use. The life of the equipment is the time period between the time it was installed and the time it becomes useless and is scrapped. A simple defi nition of depreciation per annum is the difference between the fi rst cost of the equipment less the scrap value (if any) divided by the life in years (the straight line method):
15.2 COST OF A PLANT
A plant includes various processing and auxiliary equipment, the cost of a variety of materials, such as raw materials, utilities like steam, power, chemicals (other than raw materials), working personnels, and other expenses. The cost of a plant is the sum of the capital and the operating cost. Capital cost is the total cost of all the equipment installed. This is calculated as the total cost of the equipment including the cost of installation. Operating cost is discussed in the following section.
15.3 OPERATING COST
The operating cost is the yearly cost or expenses for running the plant. This includes the cost of the raw materials, chemicals, power consumed, salaries and wages of the manpower involved, overhead charges, such as depreciation for the capital cost, and other expenses.
15.4 PRODUCT COST
The product cost includes the cost of production until the raw materials are converted to fi nished products plus the cost of packing and fi lling, dispatching, after
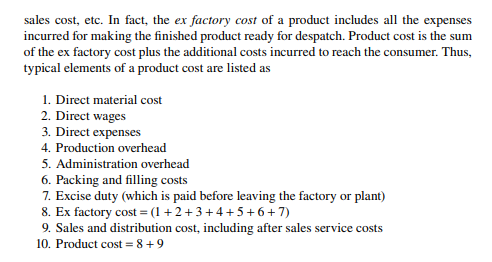
15.5 PROFIT AND PRODUCT PRICE
The product price is the sum of the product cost plus the profi t. Profi t is thus the difference between the product price and the product cost. The product price is decided by the market price and profi tability criteria, e.g., breakeven point, payout period, minimum rate of return (ROR), turnover ratio, trading rules, and various duties and taxes.
15.6 TAXES AND DUTIES
Various taxes and duties are charged by the state and central governments to the value of the product. Thus, product price includes all the duties and taxes. It is a fact that the entire burden of duties and taxes paid by the manufacturer and sellers are borne by the consumer. Details of the various taxes are available from the Gazette of India published in every fi nancial year. These are also notifi ed in newspapers during budget announcements. Thus,
Product price = product cost + profi t + taxes and duties.
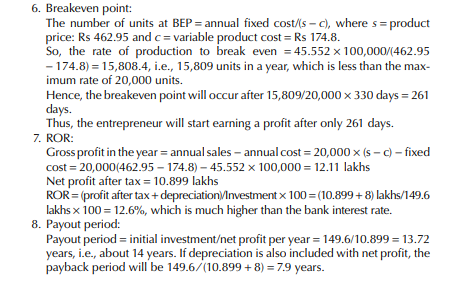
15.7 BREAKEVEN POINT, PAYOUT PERIOD, AND RATE OF RETURN
The breakeven point is expressed in terms of the rate of production units when the value earned by selling the product equals the cost of producing it, i.e., while profi t is zero. The total earnings for a certain volume of production that is sold is known as the sale volume, which is the product of the unit price of the product and the number of units of product sold. For example, if volume of product is n units in a year and the unit sale price of product is s, then sale volume = n × s. Total expenses incurred are divided into variable expenses and fi xed expenses. Variable expenses are the expenses that vary with the rate of production. Thus, if the variable cost per unit is c,
then the total variable cost incurred for the production of n units will be n × c. The fi xed expenses will not vary with the units produced and remain unchanged for any number of units produced. Examples of fi xed expenses are the salaries of the regular employees, depreciation of the plant and machineries, and rent of the land. The total expenditure will be the sum of the variable costs and the fi xed costs per year. If the fi xed cost of the plant is f, then profi t = ns − nc − f. At the breakeven point, profi t = 0 and n = f/(s − c). Hence, the number of units at the breakeven point is the fi xed costs divided by the difference of the sales price and the variable cost per unit.
15.7.1 PAYOUT PERIOD OR PAYBACK PERIOD
This is the time period within which the entire fi xed investment on the plant and machineries are earned to recover or repay. If the initial investment is acquired by a loaned amount as I and the rate of earning is r per year, the payout period = I/r per year. In fact, the initial investment will include the additional expenses in getting the license fees, land development cost, etc., in addition to the cost of the plant and machineries and the installation costs. The rate of earning is the average profi t and the depreciation per year.
15.7.2 RATE OF RETURN
The ROR is part of the initial investment earned per year. This is calculated as the ratio of the profi t per year divided by the investment, i.e., ROR = (gross profi t − tax over profi t) ∕ initial investment × 100%. This is the ROR per year, which may vary from year to year depending on the variation in profi t. If the investment is acquired by a loan at an interest of i per year, the ROR should be greater than i. In fact, the investor must earn greater than the interest payable to the lender.
15.8 LINEAR PROGRAMMING
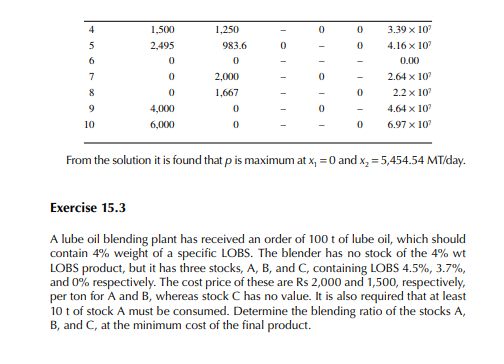
Linear programming (LP) is a mathematical tool for determining the optimum rate of production, product mix, raw material mix, etc., based on certain objective function, usually profi t is to be maximized or cost is to be minimized. These objective functions are the profi tability criteria, such as maximum profi t, maximum sales, maximum marginal profi t, minimum cost, etc. The relations between the yield of products from each production unit and their costs, constraints of limitations of units, demand of products, supply of raw materials, and other miscellaneous constraints are applicable to determine the objective function. The relations and equalities are collected and arranged as a large number of simultaneous linear algebraic equations and solved with a computer. This is an essential tool for the management to make valuable decisions, such as increasing or decreasing the rate of production during a shortage of raw materials, fl uctuation of demand of products, industrial strikes, any emergency situation, etc. This is explained in the following simple examples.
15.9.1 CATEGORY OF MATERIALS
Materials may be classifi ed as capital and consumable materials. Capital materials are machines and equipment that are partly or wholly responsible for turning raw materials into fi nished goods. Consumable materials are identifi ed into three broad classes: raw material, intermediate (or semi-fi nished goods), and fi nished goods. Raw materials are the starting materials that are processed for separation or conversion or both separation and conversion to the desired components. For example, crude oil is the main raw material in refi neries and naphtha in petrochemical plants. The quantity and price of the raw materials purchased must be recorded and stored in an identifi ed storage location. Intermediate products, part of the fi nished product obtained through the processing of raw material(s), are also identifi ed by code names and stored in an identifi ed storage location. However, the price of intermediate products may not be assessed because of the complexity of the processing operation and the costs components. But, the quantity of these products produced must be recorded accurately. However, the cost of these products may be estimated and used in the cost audit. The fi nished products are the desirable materials fi nally produced and sold. These materials are also stored in identifi ed storage locations before despatch for sales. The quantity and price must be ascertained before despatch. Finished products are also classifi ed as the main products, joint products, co-products, and by-products. The main products are the high volume products, i.e., those that are generated in the largest revenue and that infl uence the organisational profi t on a large scale. Of course, the main product is decided using other factors like national, social or political considerations. For instance, liquifi ed petroleum gasoline (LPG), petrol, kerosene, diesel, and aviation turbine fuel (ATF) are the main products from refi neries in India. The joint products are the materials produced simultaneously during the processing of the same raw material(s), e.g., LPG, naphtha, gasoline, kerosene, and diesel are the joint
products from crude oil. The co-products are the materials of similar characteristics produced from different raw materials or different processing methods. For example, gasoline is a co-product from a reforming plant or a fl uid catalytic cracking (FCC) plant. The by-products are the materials that are incidentally produced while the desirable fi nished products are obtained. For example, hydrogen is a byproduct from a plat-reforming plant, whereas it is the main product from a steam reforming plant.
15.9.2 PAPERS TO BE MAINTAINED
Myriads of transactions take place, e.g., transfer of materials from one storage location to another, either within the same premises or to other locations in the organisation or to storage location or vessels in other organisations. All these transactions are always associated with paper records signed by the appropriate authorities of both the recipients and the suppliers. The formats of these papers are designed and maintained uniquely and unanimously agreed by the organisations involved in the transactions. Some paper records are presented next as common examples. Two types of records are maintained— primary and secondary. In the primary records, dips and other details before and after each operation are maintained. Examples of primary records are the tank dip register and pass out vouchers. The secondary records are prepared based on the primary records. Daily stock, daily operation, daily pumping, monthly reports, annual reports, etc., are examples of secondary records.
15.9.2.1 Tank Dip Register
All the materials and liquid or liquifi ed gases must be stored at identifi ed locations with specifi c numbers. Dips of all these tanks are maintained every day, and every operation of receiving and transfer or despatch are recorded in a separate register known as the “tank dip register.” Solid or semi-solid materials are also recorded in specifi c storages and are maintained in the same register.
15.9.2.2 Pass Out Vouchers
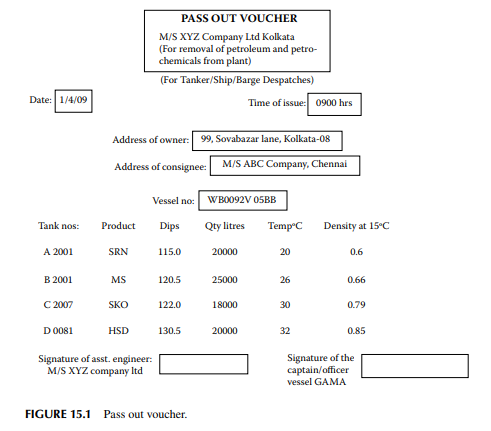
These are the valid gate passes of the vessels, wagons, trucks, etc., leaving after fi lling or loading, which contain the information, such as the name of the recipient organisation with the address, vessel number, product name, volume or mass loaded, temperature, density, etc. Such a voucher is displayed in Figure 15.1.
15.9.2.3 Tank Dip
Memos A tank dip memo is a record of the stock of any product after any receipt, transfer, or despatch. In order to have clarity in stock taking, it is essential to maintain the following modes of operation:
1. Receipts of any product should be kept preferably in a single tank from a distinct source, i.e., a particular supplier or company. The opening and closing dips with the temperature of the recipient tank must be taken before and after the receiving operation. The quantity received in the
tank and the quantity transferred from the suppliers’ vessel or tanks must be reconciled to be the same and agreed on. The dip memo is then jointly signed by the recipient and the supplier. It is also to be remembered that if multiple tanks are used for the receiving operation, a dip of all the tanks earmarked for receiving must be taken simultaneously before and after the receiving operations. Usually, this is applicable when a single product is received in a large quantity. No simultaneous receiving from any other source or despatch or transfer for processing is allowed during the receiving operation.
2. When any product is dispatched to a consignees’ vessel or tank, a single tank is preferably used for the operation and the opening and closing dips with temperature must be taken before and after the despatch operation. No simultaneous receiving or transfer or despatch from other consignees is allowed. Multiple tanks may be used simultaneously for receiving large quantities of similar products provided that the opening and closing dips of all the tanks earmarked for this receiving operation is taken before and after the operation. This is also true for simultaneous dispatch operations.
3. During any transfer operation of a raw material and fi nished product, steps (1) and (2) must be followed and dip memos are prepared. However, dip memos are not required for the transfer operation of intermediate products not declared as fi nished products from one tank to another in the same premises of the organisation; of course, this is understood from the tank dip register as discussed earlier.
15.9.2.4 Daily Stock Report
The daily stock of raw materials and fi nished product are calculated based on tank dip register data and maintained on a separate sheet.
15.9.2.5 Daily Pumping Record
The daily processing rate of raw material and the rate of production of products (intermediate and fi nished) during 24-h (i.e., from 07:00 a.m. of the previous day to 07:00 a.m. the next day) are also recorded on a separate sheet.
15.9.2.6 Daily Operation Record
This is mainly a record of all despatch operations of products.
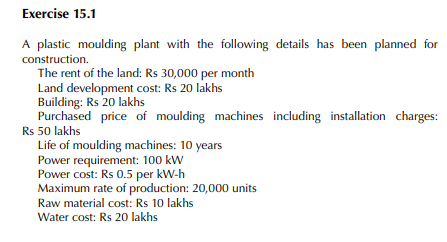
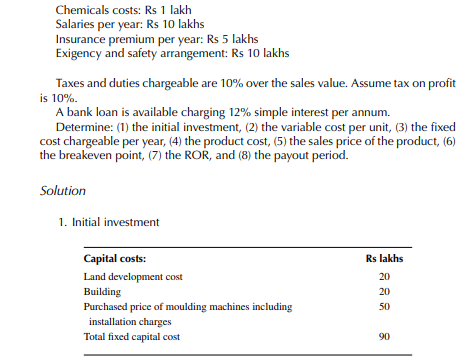
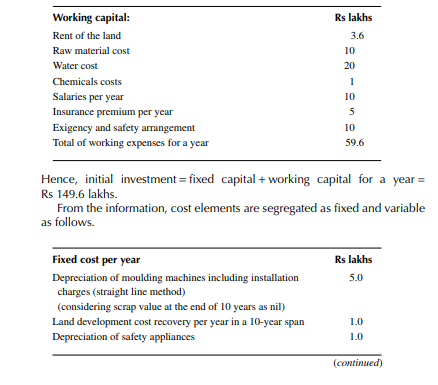
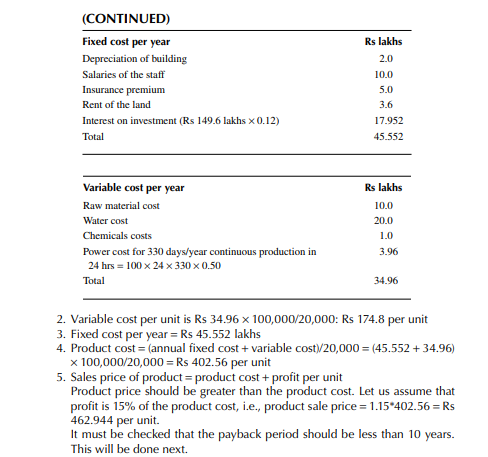
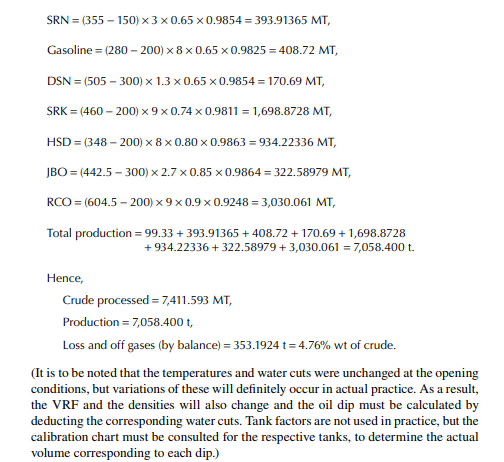
Exercise 15.4
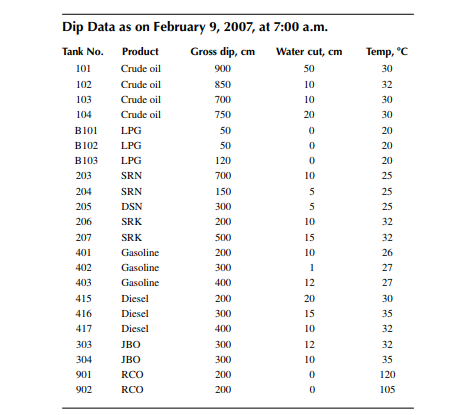
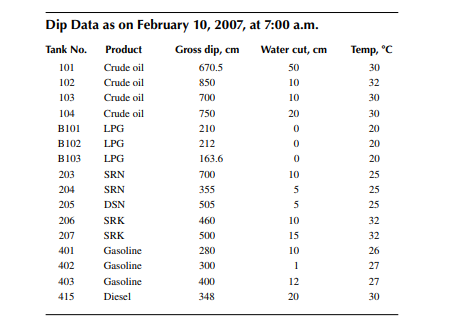
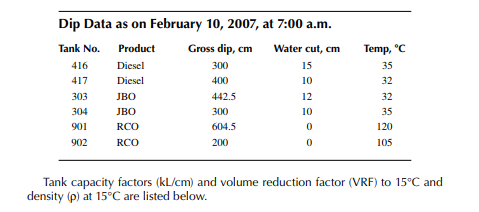
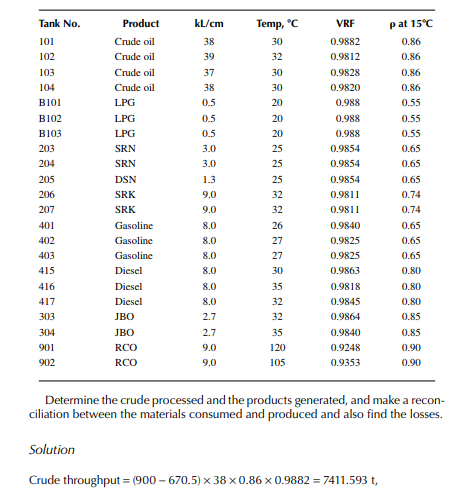
A refi nery has the processing scheme as shown in Figure 15.2. From the daily tank dip register, the following stock data are available for a 24-h operation.

15.9.3 MATERIAL AUDIT OF CAPITAL GOODS
So far, the previous discussions have been about consumable goods. Pumps, compressors, stirrers, motors, various drives, columns, and vessels are examples of capital goods. These are recorded in books giving details of specifi cations, values, date of installation, location, etc. Book values of these are maintained by deducting the amount of the annual depreciation value applicable for each of these capital goods. Small pumps, compressors, bearings, nut, bolts, screws, pipes, rods, motors, wheel keys, helmets, socks, gloves, safety shoes, recording papers, etc., are various materials that are also treated as consumable goods. These are kept in stores in specifi ed drawers or a storage area, tagged with a bin card number containing details of the
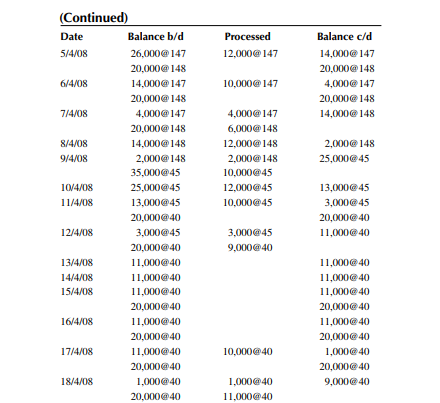
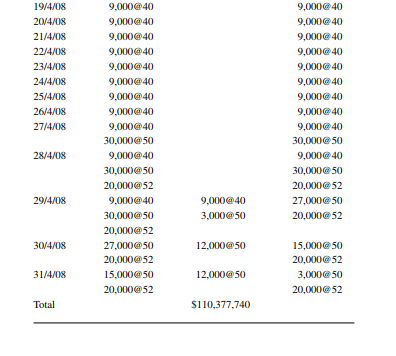
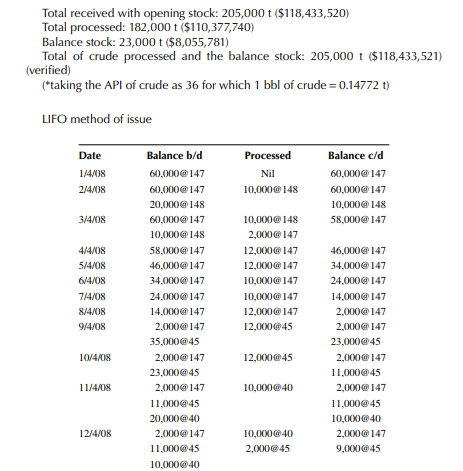
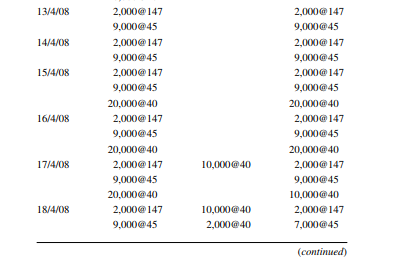
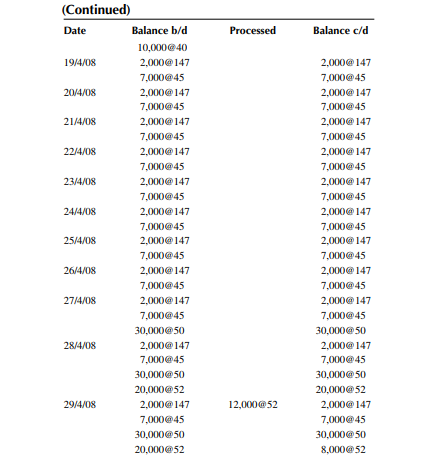
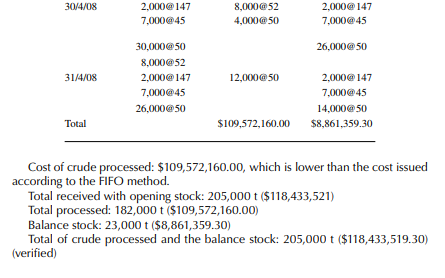
items, values, and quantity date wise. Valuation of these items are also carried out monthly based on daily receipts, issues, returns and balance of these items. Standard methods of issue, e.g., FIFO, LIFO, weighted average, etc., are applicable. A physical audit is also carried out monthly or annually to check the balance quantities with the book fi gures. The maximum material (excluding the capital goods and spares) loss in terms of crude oil and its products is typically 1% of the crude throughput in a year.
15.10 ENERGY AUDIT
Energy is consumed in any plant in the form of electricity and heat, which are required to drive the machineries and to maintain the necessary operating conditions in the processing equipment. Electricity is either purchased from external power plants or generated within the plant (captive power plant). For refi neries and petrochemical plants, a huge amount of steam is essential for the process operations. A captive power plant also serves the need for electricity and steam. Hence, the energy audit incorporates entities such as fuel, steam, and electricity. The lighting and motor drives of a plant consume a substantial amount of electricity. According to the Energy Conservation Act 2001, maximum limits are specifi ed (depending on the size of the plant) above which a penalty has to be paid by the owners of the plant. Many industries are aware of the benefi ts of conservation measures and have been improving their productivity in recent years. A regular energy audit is carried out by their own team in order to assess the performance using various options of conservation, e.g., no cost, low cost, and high value options. At the no cost option, operating conditions are changed without any investment, which leads to savings in electricity or heat loss. In fact, simple tips of good housekeeping at no cost can save crores of rupees through savings on fuel and power. At the low-cost option, less expensive methods can reduce power and heat consumption. Low cost modifi cations in the process and the replacement of old equipment may save an enormous amount of heat and power. The high value option will include major modifi cations or the replacement of an existing process plant. For example, switching a thermal cracking unit to a catalytic cracking unit, the change of a catalyst of an existing reactor, etc., can reduce power consumption. Another classic example of a high value option is replacing a traditional solvent dewaxing plant with a catalytic dewaxing plant, where power consumption of the former is about three times that of the latter.
15.10.1 ELECTRICITY AUDIT
A list of all the motor drives are recorded with their details, e.g., requisite supply voltage, frequency, rated consumption mentioned by the suppliers, day-to-day monitoring of the running hours, power consumption in terms of kilowatt-hour, and also the rate of current consumption. The no-load voltage or current must also be checked. Deviations of all these parameters must be checked daily. For audit purposes, total power consumption in a month or year must be noticed and checked against a stipulated limit. The total power consumption in the lighting of the plant and its buildings must be recorded and presented monthly or yearly. The electricity generation for a captive power plant per day, month, or year must be recorded. An inspection of the total generation must be done along with the consumption pattern.
15.10.2 THERMAL AUDIT
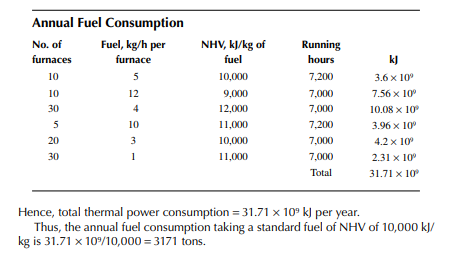
Thermal energy is obtained primarily from the combustion of fuels in the furnaces, which include the process heaters (furnaces) and also the furnaces of the captive power plant. The heat generated from a chemical reaction is also obtained as waste heat. Hence, it is essential to record the amount of fuel consumed monthly or yearly. Total heat energy is then calculated by multiplying the net heating value (NHV) of the fuel and the waste heat generated by exothermic chemical reaction or combustion in catalyst regenerators (as in FCC or hydrocracker). Thermal energy consumption is then compared with the amount of steam generated and the heat recovered in the preheaters using steam and hot products. The difference is the loss. The maximum limit of loss of thermal energy is counted by the fuel consumption in a month or a year. For example, in a typical refi nery, the maximum fuel consumption is 9% of the crude throughput in a year. Thus, the total fuel consumption and loss of consumable products is 10% of the throughput of a refi nery.
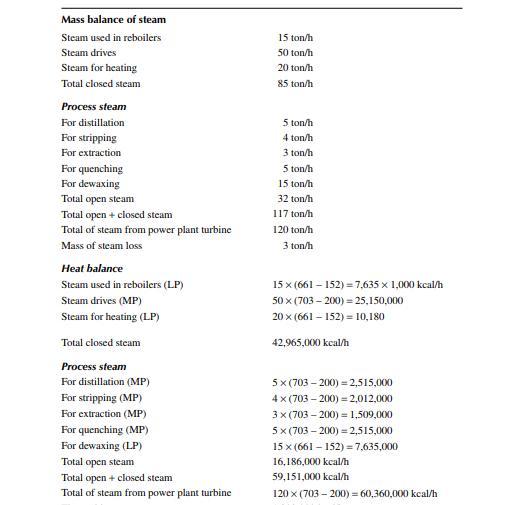
15.10.3 STEAM BALANCE
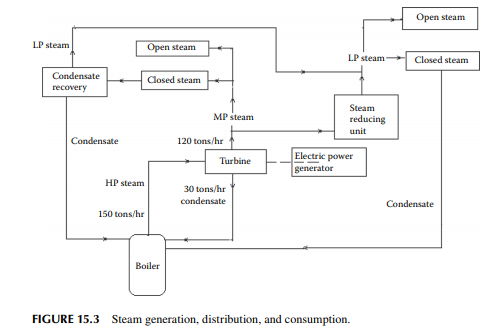
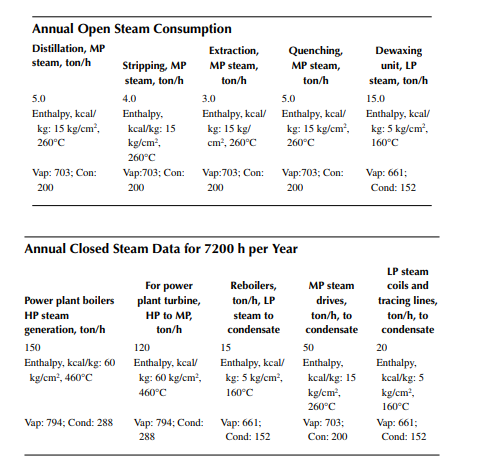
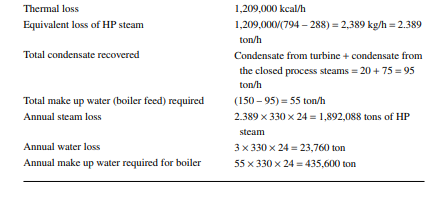
Steam generated in a power plant is high pressure (HP) superheated steam above a pressure of 50–60 kg/cm2 and at a temperature of around 450°C. This steam is used to drive the turbine for power generation and is fi nally condensed to liquid water. Additional steam is generated in the boiler, which is converted to medium (MP) and low pressure (LP) steam. MP steam is used for stripping and distillation and also for driving small steam-driven pumps and compressors. LP steam is mainly used for heating purposes in the reboilers and steam-tracing lines. A balance of these HP, MP, and LP steam is carried out by using their respective enthalpies and quantities. It is to be mentioned that even though the mass of steam (possessed by the weight of water) of a certain quality (HP, MP, or LP) may be unchanged, the enthalpy may be changed and will cause loss of steam. Loss of steam may also occur materially to the surroundings. Hence, the steam balance is also associated with the condensate balance. Thus, the water condensed from the turbine, process heaters, reboilers and steam coils in the tanks and vessels, steamtracing coils, etc., where steam fl ows in a closed system (conduits) and does not come in contact with the process fl uids, is recovered and recycled as the boiler feed water. The difference between the amount of boiler feed water and the recycled condensates is the loss of boiler feed water. It is to be noted that the steam balance involves both the material and heat balance of water used in steam generation. A steam generation, distribution and consumption in a refi nery is shown in Figure 15.3.
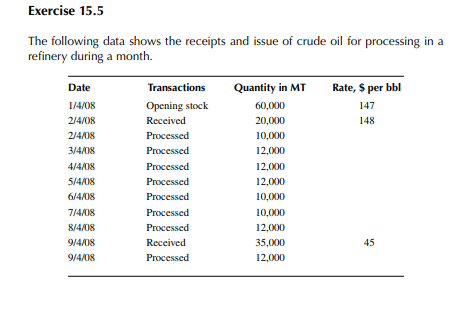
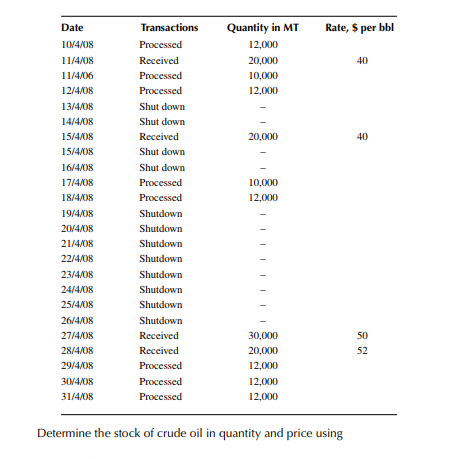
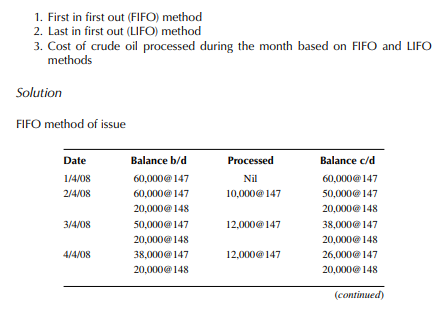
Exercise 15.8
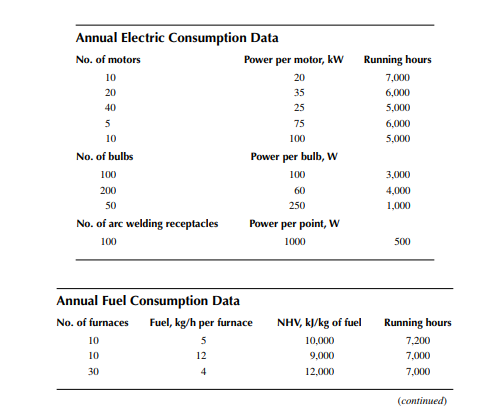
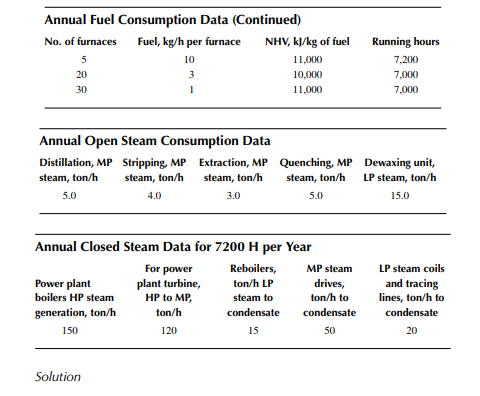
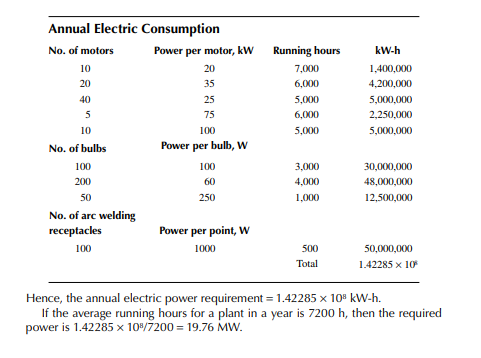
From the following information, determine the annual electric consumption, fuel consumption, steam balance, condensate recovered, and makeup boiler feed water requirement.