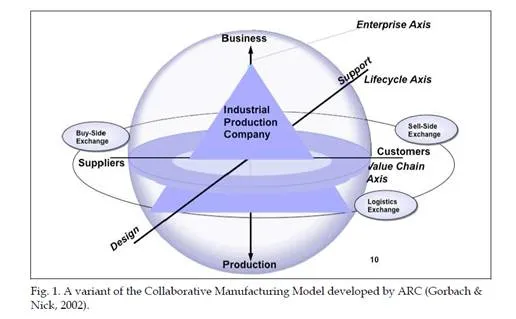
The market for many industrial production companies is getting tougher as the global competition is increasing. The collaborative manufacturing model, see Figure 1 (Gorbach & Nick, 2002), reflects the fact that companies today need to collaborate both externally and internally to reach success on the market. The external collaboration is presented through the two horisontal axis’. The value chain axis highlights the need for cooperation with suppliers and customers, and the lifecycle axis that goes from design to support often includes third parties and thereby also calls for external collaborations. The vertical axis, the enterprise axis, represents the need for internal cooperation from the business side to the production side, sometimes expressed in statements such as ”shop floor to top floor”,”sensor to boardroom” or ”Plant to enterprise”. The internal cooperation is, in this article refered to as Enterprise Control.
Enterprise control includes different aspects of control, monitoring, supervision and data and information management. Taking care of these aspects has become increasingly important and today there are several products out on the market dealing with these issues. From the operator’s perspective they can be supported via different means such as implementation through textual languages, or implementation through graphical languages etc.The usage of graphical languages has many advantages such as giving the user a good visual interpretation of what is happening (compare “a picture says more than a thousand words”), the user often believe it is easier to program by graphical means then by textual means, increased possibility to use colours, etc. In this spirit, the possibility to have one common graphical language for Enterprise Control is very appealing. A well developed graphical language should have support for formal analysis, have a well defined and limited number of graphical elements, good abstraction facilities, and a solid base in it syntax, semantics and pragmatics.The aim if this paper is to present trends, similarities and differences in the usage of graphical languages within Enterprise Control. The paper also gives ideas of how a common language could be used to increase the internal collaboration and what advantages this could bring.
Production systems
Industrial production can be classified in many various ways. One natural way is to classify them according to the industrial sector they are acting within. Example of such sectors are; Food& Beverage, Pharmaceutical, Metal, Pulp&Paper, Chemical and PetroChemical, Refining, Automotive, Fine chemicals, Biotechnology, Machine parts etc (Martin & Hale, 2010).Another way of classifying industrial production is according to the main manufacturing process that they have. Three types of manufacturing processes exists; continuous, discrete and batch. There are industrial production systems that include all three types of processes and there are others that operates only one of them. It is common to refer to an industrial production system according to the dominant type of process (Brandl, 2006).
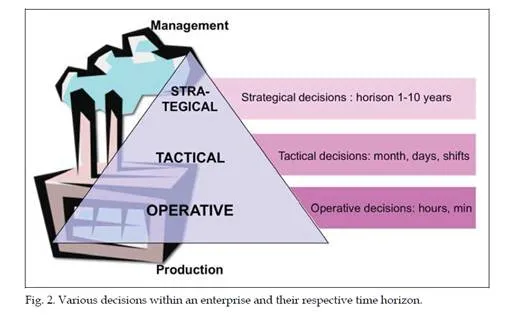
Many and various decisions related to production have to be taken. The decisions can be divided in several layers ranging from long-time strategic decisions to real-time decisions. This is true for all types of industrial production companies. The decisions concern various types of issues ranging from long-time financial issues, planning, and procurement, through tactical decisions down to operative and real time decisions associated to automated control and human actions, see figure 2.
Industrial production software systems
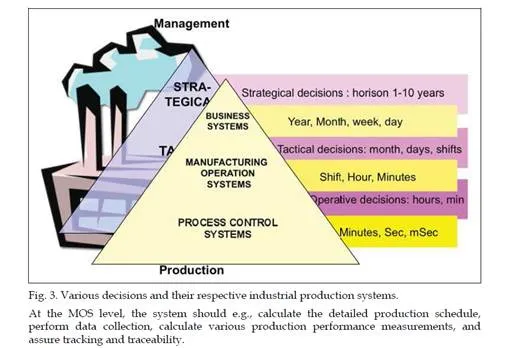
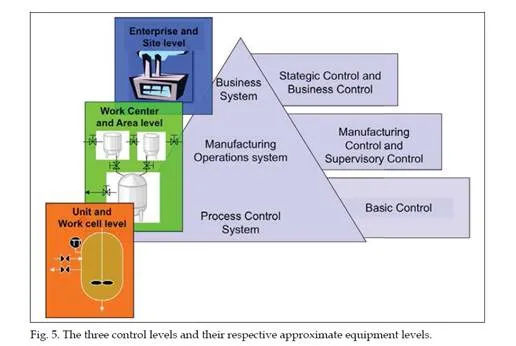
In order to help with the production related decisions, various software systems are available. Generally speaking, industrial production software systems can be divided into three layers. Closest to the actual process/plant, the process control systems (PCS) reside, with a manufacturing operations system (MOS) often on top of this, and a business system (BS) constituting the superior system, see figure 3.At the BS level, the system needs to be able to perform reasoning. The system is e.g., responsible for modifying the basic plant production schedule for orders received, based on resource availability changes, energy sources available, power demand levels, and maintenance requirements, etc.
Current usage of graphical languages
Roughly speaking one could say that the PCS system should effectuate control of the equipment at the level of and the level below the unit and work cell level. The MOS system should assure the control of the activities residing at the work center, area and/ or site level, and the BS system should have control of the activities at the site and enterprise level. (Johnsson, 2008). This is highlighted in figure 5.
Graphical languages at the PCS level
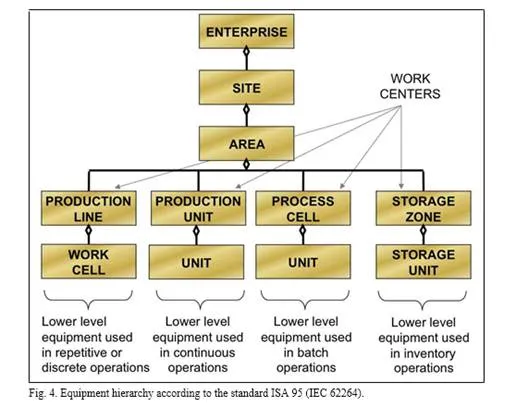
The process control system should assure that basic control issues are taken care of, i.e., control issues that are dedicated to establishing and maintaining a specific state of equipment or process condition, and/or simple on/off control. The process control system often depends on the type of industry where it is applied; discrete, continuous or batch.
• Continuous processes are characterized by the production of material in a continuous flow e.g., bulk chemicals, pulp and paper production. In continuous industries the basic control consists of running a system in steady state.
• Discrete processes are characterized by production of a specific quantity of material, where each element of the material can be uniquely identified, e.g., production of cars. In discrete processes the basic control includes the control of start up, transition and shut down phases.
• Batch processes are characterized by generation of finite quantities of material, called a batch, at each production cycle. Material is produced by subjecting specific quantities of input materials to a specified order of processing actions using one or more pieces of equipment. One example could be the production of cookies, in which several cookies are produced in the same batch. The cookies produced in the same batch can not be uniquely identified, but the cookies produced by different batches can be identified. Basic control for batch processes includes characteristics from both continuous and discrete processes.IEC 61131-3 is a global standard for industrial control programming at the PCS level (IEC,1993).
The standard specifies the syntax and semantics of a five programming languages; Instruction List, Structured Text, Ladder Diagram, Function Block Diagram and Sequential Function Chart (SFC). Two of the languages are textual; Instruction List and Structured Text, and two are graphical; Ladder Diagram and Function Block Diagram. In addition, the graphical language Sequential Function Chart (SFC) is defined with the purpose of structuring the internal organization of a program.IEC 60848 is another international standard that specifies Grafcet. Grafcet was proposed in France in 1977 as a formal specification and realization method for logical controllers. During several years Grafcet was tested in French industries. It soon proved to be a convenient tool for representing small and medium scale sequential systems at the PCS level. In 1988 Grafcet, with minor changes, was adopted as an international standard known as IEC 60848 (IEC, 1988).
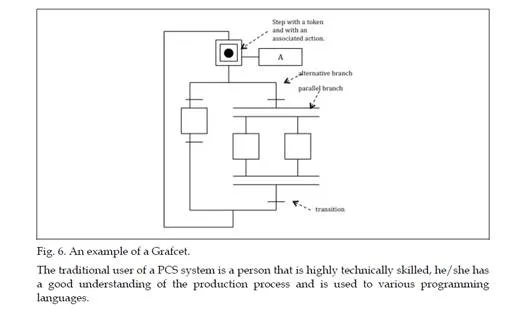
The basic building blocks in Grafcet and SFC are steps and transitions. An example of a Grafcet/SFC is shown in Figure 6.In discrete and batch manufacturing, graphical languages such as Grafcet or SFC (Sequential Function Chart) are commonly used. These languages are both based on a state/transition model and can therefore be used in order to express the sequential order in which actions should be carried out. Due to their intuitive nature and their ease of use, they have become very popular. Within continuous industries, textual languages are still most frequently used, however, a sequential language such as Grafcet or SFC can be used for certain tasks.
Graphical languages at the MOS level
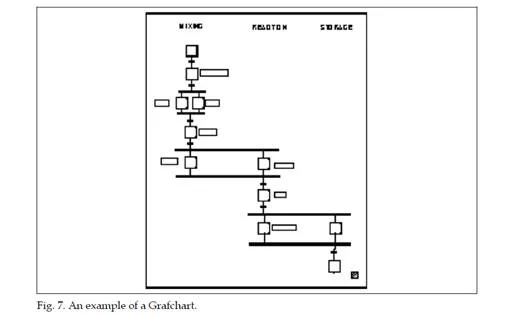
At the MOS level there is a need for both supervisory control at the work cell level and for, what could be called, “manufacturing control” at the area and site level.Within the batch community a language called Procedural Function Chart (PFC), aimed at supervisory control, has been proposed and included in the ISA standard for batch control called ISA 88.01 (ISA, 1995). This standard has also been accepted as an international standard referred to IEC 61512-1 (IEC, 1997). The PFC takes care of the control of activities at the process cell level. PFC is highly influenced by Grafcet/SFC regarding its syntax. PFC is becoming popular also in the discrete industry. Another graphical language developed recently and aimed at supervisory control applications at the process cell level is Grafchart (Johnsson, 1999). Grafchart has been developed at Lund Institute of Technology, Sweden since 1991 (Arzén, 1991). Grafchart is based on Grafcet/SFC. It contains support for step with actions, transitions, parallel and alternative branching, and macro steps. An entire chart can be encapsulated within a Grafchart process and sequences that are executed in more than one place can be represented as Grafchart procedures. In addition to this there is additional support for procedural programming (procedural step) and for separate execution threads (process steps). These two new graphical elements together with the fact that Grafchart is object- oriented and that it has support for parameterization and methods and message passing highly facilitates the reusability of an implementation. Grafchart served as a source of inspiration for PFCs. An example of a Grafchart, used for structuring a batch recipe at the process cell level, is shown in Figure 7.
The typical user of a MOS system is an operator working in the production plant and/or its production manager. Both persons have a good understanding of the production process and are often technically skilled. In case the production plant is executed by manual actions, the operator might use the graphical language for visualizing the sequential order of the operations he/she should perform. If the production plant is run automatically by various equipments and machines, the operator might use the graphical language for looking at the sequential progress of the execution taking place in the production plant. The manufacturing operation systems have lately received a lot of interest form the industries. The reason being that there is a need for a clear definition of activities at this level as well as a desire of a more sophisticated and advanced coordination control at this level, let’s call it “manufacturing control”. At this level, activities at the area and/or site level should be taken care of, this could for example be the synchronization of a batch process cell followed by a discrete packaging line.
Graphical languages at the BS level
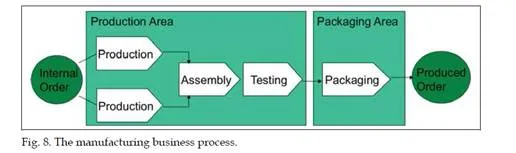
At the Business Systems level, the interest in depicting business processes has increased. Business Process Managment has been identified as a top business priority (Recker et al.,2006).Within a producing enterprise, the ultimate level depicts the overall process of going from a customer order to delivery, or from customer need to customer satisfaction. The overall business process consists of one or several sub-process, one of them is certainly manufacturing.The overall process description is used for off-line visualization of the business process for the management and board of the company. The manufacturing process, being a sub-part of the overall business process, can also be visualized. Figure 8 shows an example of a manufacturing process, i.e., how to go from internal order to produced order. The manufacturing process could span over one or many areas, e.g., the production area and the packaging area.
In many cases, the language used at this level is most often local to the company and the processes visualized are only used as off-line tool for organization improvements.In general, process models at the BS level, serve two main purposes.First, intuitive business process models are used for scoping the project, and capturing and discussing business requirements and process improvement initiatives with subject matter experts. The recent introduction of legislative frameworks such as the Sarbanes-Oxley Act (Nielsen & Main, 2004) further contributed to the increasing interest in business process modeling as a way of capturing and graphically documenting the processes of an organization (Recker et al., 2006). Second, business process models are used for process automation, which requires their conversion into executable specifications, i.e., turning the depicted processes into an on-line workflow management system (Recker et al., 2006). The graphical languages for processes are being harmonized, one example of such an initiative is The Business Process Modeling Notation (BPMN) developed by Business Process Management Initiative (BPMI), (BPMI, 2007). The typical person interested in the business processes are management, i.e., usually persons without a deep technical knowledge of the production process. In addition, the management does more often have a strategic or economic interest in looking at the processes.
Situation at present
The The situation concerning the usage of graphical languages could be summaries in the following way, see also figure 9:
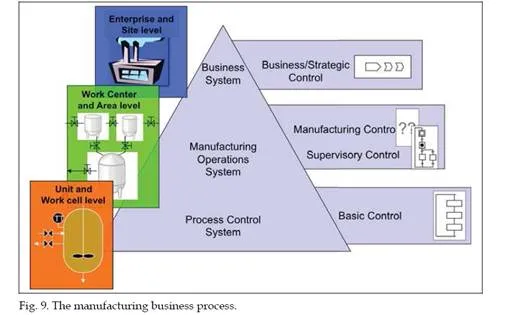
• PCS level: Standardized graphical languages are used for basic control issues.
• MOS level: Standardized graphical languages exist and are, together with some proprietary graphical control languages, used for supervisory control issues. None or only local graphical control languages are used for “Manufacturing control” issues.
• At the PCS and MOS level, the languages are use for executing control over the production process. The graphical language has a bi-directional communication with the plant, i.e., data can be collected from the plant and visualized for the user by the
means of a graphical language, or data can be sent to the plant through the graphical language.
• The syntax and semantics of the languages used at the PCS and MOS level are very similar.
• BS level: Local graphical languages are used for visualising the business processes.
Initiatives exist striving to standardize the language used for visualization of business processes.
• At the BS level, the languages are used for presenting the business processes. The languages do not have a communication with the production plant.
• The syntax of the languages used at the BS level is different from the one used at the
PCS and MOS level.
Integration
As global competition in manufacturing has increased, trends within industry have been to increase the level and amount of control and automation at all three levels. The requirement to increasing the integration between the three levels is also notable, being driven by business needs and business processes, see figure 10.There are always some business processes that needs information from production or needs to exercise control over production. Typical business drivers of today are; Just in time production (requires detailed knowledge about the available capacity in the plant), asset
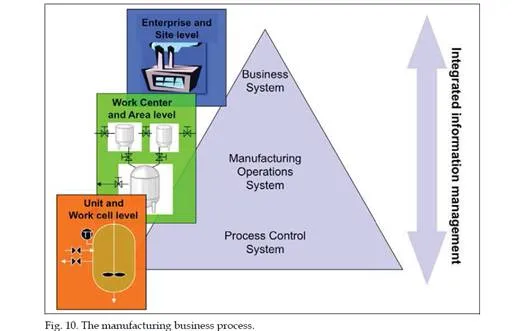
efficiency and overall equipment efficiency (requires detailed knowledge of actual use), reduced cycle time (requires detailed knowledge about start and stop times), new regulations for tracabilty (requires better logging and tracking possibilities), finding hidden potentials (requires the collection and analysis of previously unknown data), etc. Another approach to integration is Unified Enterprise Modeling Language, UEML. However, UEML is not intended as a programming language by itself but rather as an intermediate language, or a hub, through which different languages can be connected (UEML, 2007).
Grafchart
Grafchart is the name of graphical language for sequential control applications (Johnsson,1999). The language of Grafchart is, like any other programming language, fully defined by its syntax, semantics and pragmatics, (Turbak et al., 1995). The syntax defines the notations used, the semantics defines the meaning of the syntax, and the pragmatics focuses upon how the semantics is implemented. Grafchart is based on Grafcet/SFC. There are strong similarities beween Gracfet and Grafchart regarding both the syntax, semantics and pragmatics (Johnsson 2000).
• Syntax: The graphical syntax of Grafchart and Gracet is very similar. Both are based on steps and transitions with support for macro steps, parallell and alternative branches, see figure 6 and 7. The Grafchart language contains more graphical elements (building blocks) than Grafcet. The new building blocks introduced in Grafchart are: Grafchart process, Grafchart procedure, process step, Procedure step and exception transition. However, the new building blocks does not extend the functionality of Grafchart compared to Grafcet, but they facilitates the implementation of more advanced sequence structure. The development of Grafchart from Grafcet can be compared to the evolution of assembler languages to a high-level programming language like e.g., Java.
• Semantics: The firing rules that apply to Grafchart are similar to those of Grafcet. Rule
1: All fireable transitions are immediately fired – this rule applies to Grafcet and Grafchart. Rule 2: Several simultaneously fireable transitions are simultaneously fired – for Grafcet this is true in all situations, for Grafchart this is true for all situations except in an ordivergence. Rule 3: When a step must be simultaneously activated and deactivated, it remains active – this rule apply to Grafcet but not to Grafchart. In Grafchart, the step will first be deactivated and then activated again.
• Pragmatics: the actual implementation of the language transformes the language from being a model to being a toolbox/framework. There are several software systems implementing Grafcet. Grafchart exists in two versions; one version is implemented in G2, an expert system from Gensym corporation, and one version is implemented in Java and refered to as JGrafchart (Arzen, 2002).
Thanks to the strong connection between Grafchart and Grafcet a user of one of the langauges would easily recognize him/her self in the other language.Grafchart is also influenced by ideas from Petri nets, high-level Petri Nets and object- oriented programming. By adding new features to the language, Grafchart is suitable for supervisory control applications at the MOS level. The new features are;
• Parameterization: Macro steps, and steps may have attributes acting as parameters. The parameters can be accessed from within the step actions and the transition receptivities using a special notation “sup.attribute”. The parameters are given their actual values when the procedure is called.
• Methods and message passing: The method feature denotes the possibility to have Grafchart procedures as methods of general objects. From the body of the Grafchart procedure realizing the method it is possible to reference the attributes of the object that the method belongs to using a special “self.attribute” notation.
A method is called through a procedure step. The method that will be called is determined by an object reference and a method reference. At the MOS level, there is an international well accepted standard, IEC 62264, also refered to as ISA95. The standard has several parts, the first ones are published whereas the later ones are still under development. The standard recognized the need for support for presenting Manufacturing control applications, possibly through a graphical language (ISA, 2005). The advantages of graphical programming languages are simplicity and declarativeness, this is true at all levels; PCS, MOS and BS. The graphical languages often allow programming in a style that closely mimics the style that people model problems. Examples of mental models that are naturally represented graphically include fault trees, organization charts, programflowcharts, and block diagrams. Graphical languages fit users’ existing perception of problem, making the application easier to build, debug, document, and maintain. An added benefit is the possibility to use colour and animation to provide feedback as the program executes.
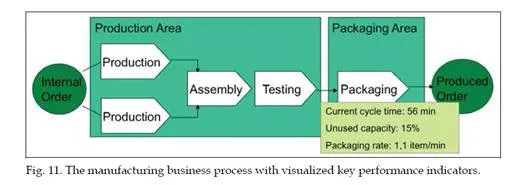
As the vertical integration between the levels becomes more and more important it would be challenging to see, if and what, a unified common graphical language for BS, MOS and PCS level, could bring.One future scenario could be to connect the business processes to the Manufacturing Operations Systems. This would imply that the business processes could get data directly from the plant, and thereby directly visualize various key performance indicators (KPIs) for the management, see figure 11.
Conclusions
The focus for this article is graphical languages used at companies in the producing and manufacturing sector and to issues related to production. The production systems used within the companiy can be divided in three hierarchical levels; Process Control Systems, Manufacturing Operations Systems and Business Systems. The trends, similarities and differences in the usage of graphical languages at these three levels are examined. There are strong similarities between the languages used at the PCS level for basic control and the languages used at the MOS level for supervisory control. At these levels, the activities at the unit level and below are taken care of, and there is a very close connection to the production occurring in the plant.There is currently no standardized graphical language for “manufacturing control”, i.e., for coordinating and synchronizing the activities between various work centers and area.
At the BS level, the business processes are modelled and executed. Initiatives exist that strive to standardize the graphical language used at this level. The syntax is different from the one used at the PCS and MOS level. The business processes seldom has a connection to the production plant. Various KPIs and aggregated data from the plant are, rarely presented by the mean of a graphical language.
A future trend within Enterprise control will certainly be to further investigate, if, to what extent and how, the graphical languages used at the three levels could be harmonized, and to explore the advantages this could bring to its user.