
A fortune teller may try to predict when a person will die based on the length of the lines in their hand or tea leaves floating in a cup. A good fortune teller will also try to look deeper and combine their observations and experience to refine their prediction. “Let’s see, this guy is smoking a cigar, drinking a martini, and looks terrible — I think I’ll reduce my original estimate….”
In the engineering world, the prediction of when a component will fail can sometimes seem as arbitrary. However, there are many advanced theories and methods available to the engineer to help make estimates of a component failure. But it still takes a little fortune teller insight, in the form of experience, to apply these methods to obtain accurate estimates.
For example, consider the case of life prediction due to fatigue. Fatigue is failure under a repeated load which would never reach a level sufficient to cause failure in a single application. The underlying cause of the failure is the initiation and growth of a crack that eventually reaches critical size, resulting in failure which often occurs without warning. The general approach to predicting fatigue life, assuming classical high cycle fatigue (lives greater than 10,000 cycles) is to test a component to failure using a range of cyclic load amplitudes, and thus construct an S-N curve like the one shown below. The engineer can then use this S-N data to predict life based on the cyclic stress that the component is expected to see in the field.
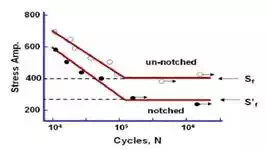 |
However, this simple procedure requires some engineering interpretation. S-N data usually plots the typical or average life curve. A 50% chance of survival is not an acceptable probability for most engineering products, and therefore the S-N data will require adjusting based on the scatter in the data and the acceptable failure probability. This adjustment, for example considering aluminum, is on the order of 30% below the average data.
The surface finish of the component plays a major role in fatigue life prediction, since it is assumed that failures will initiate from the surface, and the rougher the surface the lower the life. A guideline is to assume an additional 10% reduction in the S-N data to account for potential surface roughness.
Other factors can also play a role in lowering the life further. A cyclic stress with a mean stress of zero (fully reversed) is usually assumed in S-N data, but if the mean stress is greater than zero, the effect is to reduce life. There are also other effects that can add or subtract to the life based on high stress gradients near notches, and the size effect due to the difference in volume of the S-N test specimen versus the volume of material stressed in the actual part. Thus, it is not uncommon to expect that the design stresses could be 30% to 40% below the typical fatigue limit stress to meet the life criterion for an engineering component.
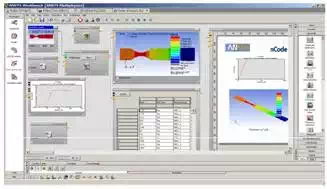
Keeping track of all of these factors can be daunting – special software tools can simplify the process and reduce costly mistakes. One example is nCode DesignLife, which is integrated within ANSYS Workbench to provide a complete stress analysis and life prediction system. This system provides access to all of the above-mentioned fatigue settings and many more in an easy-to-use interface.
 |