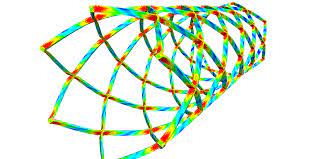
 Analysis of structures undergoing permanent deformation is something that CAE Associates routinely performs as part of its FEA consulting services. A typical example is a battery crimping process, which involves multiple components subject to plastic deformation.
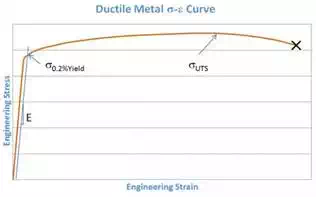
Of great importance to the accuracy of these analyses are the material properties. Characterization of plasticity in ductile metals can be derived from a tensile test. If the load as a function of displacement is the output from the test apparatus, how can that information be used to describe the behavior of the microstructure of the material? Divide the force by the area of the specimen (engineering stress) and divide the displacement by the original specimen length (engineering strain) and we’re getting a little closer. Such data might look like what’s shown below:
After the yield stress and up to the ultimate strength (UTS) the curve exhibits strain hardening. This is a way the material can carry more load even with a reduction in cross-sectional area (caused by the shearing of molecular bonds). The stress will continue to increase with strain as long as the strain hardening can compensate for this reduction in area. Once it can no longer compensate, at the UTS, the cross-sectional area changes faster than the increase in stress and a strain softening response is seen, up to failure. The maximum point on the curve, UTS, occurs due to geometrical effects but does not describe the actual stress state in the specimen. Remember, this data comes from the testing apparatus.
If determining the actual stress state of the material is of importance, e.g. for use in a finite element simulation; then a different metric will be need to be used to describe the material behavior. Knowing this and how to convert the reported data is key. Let’s convert it for use in a simulation.
First off, only so much information can be obtained from this data. The equations that relate engineering stress and strain to the true stress and strain of the material are valid up to the UTS. Afterwards, the instantaneous cross-sectional area would need to be measured in test to derive what the true stress and strain relationship was.
Once the material has gone plastic, further deformation is isochoric. The plastic-flow regime has a negligible change in volume, i.e. the Poisson’s ratio is close to 0.5. This allows for the change in length to be related to the change in area and the engineering stress – strain (σe-εe) data can be converted into true stress-strain (σt-εt) data up to the UTS with the following equations:
σt=σe (1+εe), εt=ln(1+εe)
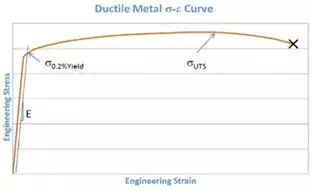
If the both sets of data are plotted in the same chart, they would look as shown below: 
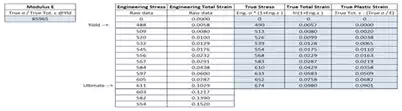
Structural analysis codes may require that the stress – strain data be input in terms of the True Stress versus the True Plastic Strain. In which case, the data can be converted as follows:
Calculate the Modulus = True Stress at Yield / True Total Strain at Yield
Next, convert the Engineering data to True data based on the equations above. Then subtract off the True Elastic Strain from the True Total Strain at each point to find the True Plastic Strain (True Plastic Strain = True Total Strain – True Stress / Modulus).
Using actual data, the conversion is shown below:
 |
Some important points about this data:
1) The first point on the True Stress – True Total Stain curve defines the slope or the elastic response of the material (i.e. the Modulus, therefore these points must match by Hooke’s Law: Stress = Modulus * Strain).
2) At each True Total Strain increment, True Elastic Strain (the True Stress at that increment divided by the modulus) is subtracted off to determine the corresponding True Plastic Strain.
3) The True Total Strain at yield is equivalent to the True Elastic Strain and the True Plastic Strain at this point is zero.
4) If the simulation code allows for the input of stress versus total strain, the first point input should correspond to the True Stress at Yield and True Total Strain at Yield.
5) If the simulation code allows for the input of stress versus plastic strain, the first point input should correspond to the True Stress at Yield and True Plastic Strain at Yield (which will be input as zero).
6) The True stress – strain data is calculated up to the ultimate strength of the test data.Simulation codes may assume that the material is perfectly plastic after this point (i.e. strain will continue to increase without an increase in stress).