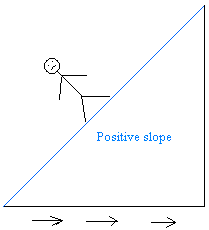
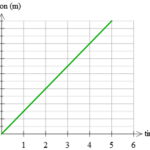
The shapes of the position versus time graphs for these two basic types of motion – constant velocity motion and accelerated motion (i.e., changing velocity) – reveal an important principle. The principle is that the slope of the line on a position-time graph reveals useful information about the velocity of the object. It is often said, “As the slope goes, so goes the velocity.” Whatever characteristics the velocity has, the slope will exhibit the same (and vice versa). If the velocity is constant, then the slope is constant (i.e., a straight line). If the velocity is changing, then the slope is changing (i.e., a curved line). If the velocity is positive, then the slope is positive (i.e., moving upwards and to the right). This very principle can be extended to any motion conceivable.
Contrasting a Slow and a Fast Motion
 Consider the graphs below as example applications of this principle concerning the slope of the line on a position versus time graph. The graph on the left is representative of an object that is moving with a positive velocity (as denoted by the positive slope), a constant velocity (as denoted by the constant slope) and a small velocity (as denoted by the small slope). The graph on the right has similar features – there is a constant, positive velocity (as denoted by the constant, positive slope). However, the slope of the graph on the right is larger than that on the left. This larger slope is indicative of a larger velocity. The object represented by the graph on the right is traveling faster than the object represented by the graph on the left. The principle of slope can be used to extract relevant motion characteristics from a position vs. time graph. As the slope goes, so goes the velocity.
| Slow, Rightward(+) Constant Velocity | Fast, Rightward(+) Constant Velocity |
 |  |
 Consider the graphs below as another application of this principle of slope. The graph on the left is representative of an object that is moving with a negative velocity (as denoted by the negative slope), a constant velocity (as denoted by the constant slope) and a small velocity (as denoted by the small slope). The graph on the right has similar features – there is a constant, negative velocity (as denoted by the constant, negative slope). However, the slope of the graph on the right is larger than that on the left. Once more, this larger slope is indicative of a larger velocity. The object represented by the graph on the right is traveling faster than the object represented by the graph on the left.
| Slow, Leftward(-) Constant Velocity | Fast, Leftward(-) Constant Velocity |
 |  |


