In the previous section of Lesson 4, the vector nature of the electric field strength was discussed. The magnitude or strength of an electric field in the space surrounding a source charge is related directly to the quantity of charge on the source charge and inversely to the distance from the source charge. The direction of the electric field is always directed in the direction that a positive test charge would be pushed or pulled if placed in the space surrounding the source charge. Since electric field is a vector quantity, it can be represented by a vector arrow. For any given location, the arrows point in the direction of the electric field and their length is proportional to the strength of the electric field at that location. Such vector arrows are shown in the diagram below. Note that the lengths of the arrows are longer when closer to the source charge and shorter when further from the source charge.

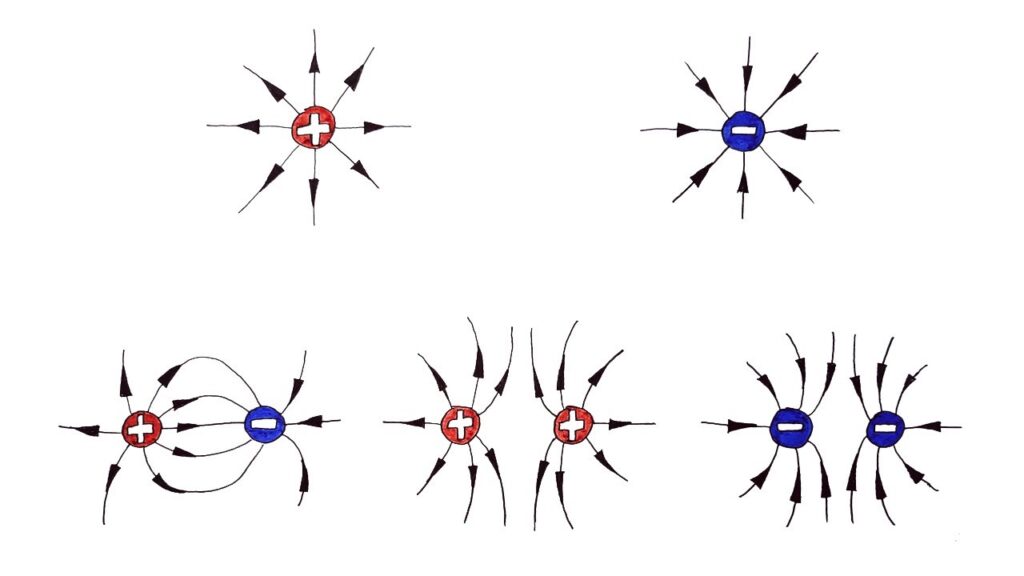
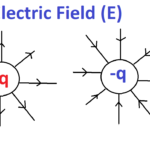
A more useful means of visually representing the vector nature of an electric field is through the use of electric field lines of force. Rather than draw countless vector arrows in the space surrounding a source charge, it is perhaps more useful to draw a pattern of several lines that extend between infinity and the source charge. These pattern of lines, sometimes referred to as electric field lines, point in the direction that a positive test charge would accelerate if placed upon the line. As such, the lines are directed away from positively charged source charges and toward negatively charged source charges. To communicate information about the direction of the field, each line must include an arrowhead that points in the appropriate direction. An electric field line pattern could include an infinite number of lines. Because drawing such large quantities of lines tends to decrease the readability of the patterns, the number of lines is usually limited. The presence of a few lines around a charge is typically sufficient to convey the nature of the electric field in the space surrounding the lines.

Rules for Drawing Electric Field Patterns
There are a variety of conventions and rules to drawing such patterns of electric field lines. The conventions are simply established in order that electric field line patterns communicate the greatest amount of information about the nature of the electric field surrounding a charged object. One common convention is to surround more charged objects by more lines. Objects with greater charge create stronger electric fields. By surrounding a highly charged object with more lines, one can communicate the strength of an electric field in the space surrounding a charged object by the line density. This convention is depicted in the diagram below.

Not only does the density of lines surrounding any given object reveal information about the quantity of charge on the source charge, the density of lines at a specific location in space reveals information  about the strength of the field at that location. Consider the object shown at the right. Two different circular cross-sections are drawn at different distances from the source charge. These cross-sections represent regions of space closer to and further from the source charge. The field lines are closer together in the regions of space closest to the charge; and they are spread further apart in the regions of space furthest from the charge. Based on the convention concerning line density, one would reason that the electric field is greatest at locations closest to the surface of the charge and least at locations further from the surface of the charge. Line density in an electric field line pattern reveals information about the strength or magnitude of an electric field.
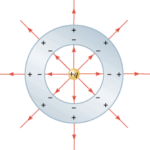
A second rule for drawing electric field lines involves drawing the lines of force perpendicular to the surfaces of objects at the locations where the lines connect to object’s surfaces. At the surface of both symmetrically shaped and irregularly shaped objects, there is never a component of electric force that is directed parallel to the surface. The electric force, and thus the electric field, is always directed perpendicular to the surface of an object. If there were ever any component of force parallel to the surface, then any excess charge residing upon the surface of a source charge would begin to accelerate. This would lead to the occurrence of an electric current within the object; this is never observed in staticelectricity. Once a line of force leaves the surface of an object, it will often alter its direction. This occurs when drawing electric field lines for configurations of two or more charges as discussed in the section below.
A final rule for drawing electric field lines involves the intersection of lines. Electric field lines should never cross. This is particularly important (and tempting to break) when drawing electric field lines for situations involving a configuration of charges (as in the section below). If electric field lines were ever allowed to cross each other at a given location, then you might be able to imagine the results. Electric field lines reveal information about the direction (and the strength) of an electric field within a region of space. If the lines cross each other at a given location, then there must be two distinctly different values of electric field with their own individual direction at that given location. This could never be the case. Every single location in space has its own electric field strength and direction associated with it. Consequently, the lines representing the field cannot cross each other at any given location in space.
Electric Field Lines for Configurations of Two or More Charges
In the examples above, we’ve seen electric field lines for the space surrounding single point charges. But what if a region of space contains more than one point charge? How can the electric field in the space surrounding a configuration of two or more charges be described by electric field lines? To answer this question, we will first return to our original method of drawing electric field vectors.
Suppose that there are two positive charges – charge A (QA) and charge B (QB) – in a given region of space. Each charge creates its own electric field. At any given location surrounding the charges, the strength of the electric field can be calculated using the expression kQ/d2. Since there are two charges, the kQ/d2calculation would have to be performed twice at each location – once with kQA/dA2 and once with kQB/dB2(dA is the distance from that location to the center of charge A and dB is the distance from that location to the center of charge B). The results of these calculations are illustrated in the diagram below with electric field vectors (EA and EB) drawn at a variety of locations. The strength of the field is represented by the length of the arrow and the direction of the field is represented by the direction of the arrow.

Since electric field is a vector, the usual operations that apply to vectors can be applied to electric field. That is, they can be added in head-to-tail fashion to determine the resultant or net electric field vector at each location. This is shown in the diagram below.

The diagram above shows that the magnitude and direction of the electric field at each location is simply the vector sum of the electric field vectors for each individual charge. If more locations are selected and the process of drawing EA, EB and Enet is repeated, then the electric field strength and direction at a multitude of locations will be known. (This is not done since it is a highly time intensive task.) Ultimately, the electric field lines surrounding the configuration of our two charges would begin to emerge. For the limited number of points selected in this location, the beginnings of the electric field line pattern can be seen. This is depicted in the diagram below. Note that for each location, the electric field vectors point tangent to the direction of the electric field lines at any given point.

The construction of electric field lines in this manner is a tedious and cumbersome task. The use of a field plotting computer software program or a lab procedure produces similar results in less time (and with more phun). Whatever the method used to determine the electric field line patterns for a configuration of charges, the general idea is that the pattern is the resultant of the patterns for the individual charges within the configuration. The electric field line patterns for other charge configurations are shown in the diagrams below.

In each of the above diagrams, the individual source charges in the configuration possess the same amount of charge. Having an identical quantity of charge, each source charge has an equal ability to alter the space surrounding it. Subsequently, the pattern is symmetrical in nature and the number of lines emanating from a source charge or extending towards a source charge is the same. This reinforces a principle discussed earlier that stated that the density of lines surrounding any given source charge is proportional to the quantity of charge on that source charge. If the quantity of charge on a source charge is not identical, the pattern will take on an asymmetric nature, as one of the source charges will have a greater ability to alter the electrical nature of the surrounding space. This is depicted in the electric field line patterns below.

After plotting the electric field line patterns for a variety of charge configurations, the general patterns for other configurations can be predicted. There are a number of principles that will assist in such predictions. These principles are described (or re-described) in the list below.
· Electric field lines always extend from a positively charged object to a negatively charged object, from a positively charged object to infinity, or from infinity to a negatively charged object.
· Electric field lines never cross each other.
· Electric field lines are most dense around objects with the greatest amount of charge.
· At locations where electric field lines meet the surface of an object, the lines are perpendicular to the surface.
Electric Field Lines as an Invisible Reality
It has been emphasized in Lesson 4 that the concept of an electric field arose as scientists attempted to explain the action-at-a-distance that occurs between charged objects. The concept of the electric field was first introduced by 19th century physicist Michael Faraday. It was Faraday’s perception that the pattern of lines characterizing the electric field represents an invisible reality. Rather than thinking in terms of one charge affecting another charge, Faraday used the concept of a field to propose that a charged object (or a massive object in the case of a gravitational field) affects the space that surrounds it. As another object enters that space, it becomes affected by the field established in that space. Viewed in this manner, a charge is seen to interact with an electric field as opposed to with another charge. To Faraday, the secret to understanding action-at-a-distance is to understand the power of charge-field-charge. A charged object sends its electric field into space, reaching from the “puller to the pullee.” Each charge or configuration of charges creates an intricate web of influence in the space surrounding it. While the lines are invisible, the effect is ever so real. So as you practice the exercise of constructing electric field lines around charges or configuration of charges, you are doing more than simply drawing curvy lines. Rather, you are describing the electrified web of space that will draw and repel other charges that enter it.
Check Your Understanding
Use your understanding to answer the following questions. When finished, click the button to view the answers.
1. Several electric field line patterns are shown in the diagrams below. Which of these patterns are incorrect? _________ Explain what is wrong with all incorrect diagrams.

See Answer

Answer: C, D and E
In C, the lines are directed towards a positively charged object.
In D, the lines are not symmetrically positioned despite the fact that the object is a symmetrical sphere.
In E, the lines are directed away from a negative charge.
 2. Erin Agin drew the following electric field lines for a configuration of two charges. What did Erin do wrong? Explain.
See Answer

Electric field lines should never intersect each other. Erin crossed his lines.
3. Consider the electric field lines shown in the diagram below. From the diagram, it is apparent that object A is ____ and object B is ____.

| a. +, + | b. -, – | c. +, – | d. -, + | e. insufficient info |
See Answer

Answer: D
Electric field lines are directed towards object A so object A must be negative. They are directed away from object B so object B must be positive.
 4. Consider the electric field lines drawn at the right for a configuration of two charges. Several locations are labeled on the diagram. Rank these locations in order of the electric field strength – from smallest to largest.
See Answer

Answer: DAECB (with the order of C and B being in question)
Electric field strength is greatest where the lines are closest together and weakest where lines are furthest apart.
5. Use your understanding of electric field lines to identify the charges on the objects in the following configurations.

See Answer

Answer: Objects A, C, F, G, H and I are positive.
Objects B, D and E are negatively charged. The principle is: electric field lines always approach negatively charged objects and are directed away from positively charged objects.
6. Observe the electric field lines below for various configurations. Rank the objects according to which has the greatest magnitude of electric charge, beginning with the smallest charge.

See Answer

Answer: The rankings are as follows:
B < A
C < D
G < E < F
J < H < I
The principle is that objects with the greatest charge will have the greatest number of lines emanating from it or approaching it.


