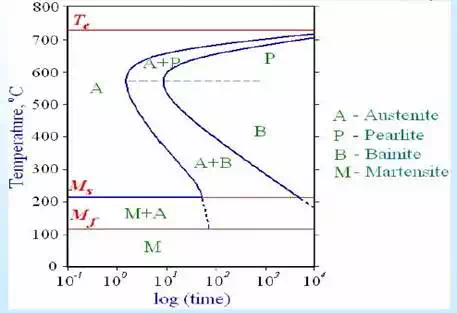
(TTT) diagrams measure the rate of transformation at a constant temperature. In other words a sample is austenitised and then cooled rapidly to a lower temperature and held at that temperature whilst the rate of transformation is measured, for example by dilatometry. Obviously a largenumber of experiments is required to build up a complete TTT diagram.
• An increase in carbon content shifts the TTT curve to the right (this corresponds to an increase in hardenability as it increases the ease of forming martensite – i.e. the cooling rate required to attain martensite is less severe).
• An increase in carbon content decreases the martensite start temperature.
• An increase in Mo content shifts the TTT curve to the right and also separates the ferrite + pearlite region from the bainite region making the attainment ofa bainitic structure more controllable.