
As mentioned in the Introduction, acoustic emissions can result from the initiation and growth of cracks, slip and dislocation movements, twinning, or phase transformations in metals. In any case, AE’s originate with stress. When a stress is exerted on a material, a strain is induced in the material as well. Depending on the magnitude of the stress and the properties of the material, an object may return to its original dimensions or be permanently deformed after the stress is removed. These two conditions are known as elastic and plastic deformation, respectively.
The most detectible acoustic emissions take place when a loaded material undergoes plastic deformation or when a material is loaded at or near its yield stress. On the microscopic level, as plastic deformation occurs, atomic planes slip past each other through the movement of dislocations. These atomic-scale deformations release energy in the form of elastic waves which “can be thought of as naturally generated ultrasound” traveling through the object. When cracks exist in a metal, the stress levels present in front of the crack tip can be several times higher than the surrounding area. Therefore, AE activity will also be observed when the material ahead of the crack tip undergoes plastic deformation (micro-yielding).
Two sources of fatigue cracks also cause AE’s. The first source is emissive particles (e.g. nonmetallic inclusions) at the origin of the crack tip. Since these particles are less ductile than the surrounding material, they tend to break more easily when the metal is strained, resulting in an AE signal. The second source is the propagation of the crack tip that occurs through the movement of dislocations and small-scale cleavage produced by triaxial stresses.
The amount of energy released by an acoustic emission and the amplitude of the waveform are related to the magnitude and velocity of the source event. The amplitude of the emission is proportional to the velocity of crack propagation and the amount of surface area created. Large, discrete crack jumps will produce larger AE signals than cracks that propagate slowly over the same distance.
Detection and conversion of these elastic waves to electrical signals is the basis of AE testing. Analysis of these signals yield valuable information regarding the origin and importance of a discontinuity in a material. As discussed in the following section, specialized equipment is necessary to detect the wave energy and decipher which signals are meaningful.
Activity of AE Sources in Structural Loading
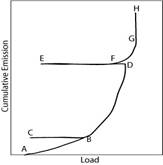 Basic AE history plot showing Kaiser effect (BCB), Felicity effect (DEF), and emission during hold (GH) 2 Basic AE history plot showing Kaiser effect (BCB), Felicity effect (DEF), and emission during hold (GH) 2 |
AE signals generated under different loading patterns can provide valuable information concerning the structural integrity of a material. Load levels that have been previously exerted on a material do not produce AE activity. In other words, discontinuities created in a material do not expand or move until that former stress is exceeded. This phenomenon, known as the Kaiser Effect, can be seen in the load versus AE plot to the right. As the object is loaded, acoustic emission events accumulate (segment AB). When the load is removed and reapplied (segment BCB), AE events do not occur again until the load at point B is exceeded. As the load exerted on the material is increased again (BD), AE’s are generated and stop when the load is removed. However, at point F, the applied load is high enough to cause significant emissions even though the previous maximum load (D) was not reached. This phenomenon is known as the Felicity Effect. This effect can be quantified using the Felicity Ratio, which is the load where considerable AE resumes, divided by the maximum applied load (F/D).
Knowledge of the Kaiser Effect and Felicity Effect can be used to determine if major structural defects are present. This can be achieved by applying constant loads (relative to the design loads exerted on the material) and “listening” to see if emissions continue to occur while the load is held. As shown in the figure, if AE signals continue to be detected during the holding of these loads (GH), it is likely that substantial structural defects are present. In addition, a material may contain critical defects if an identical load is reapplied and AE signals continue to be detected. Another guideline governing AE’s is the Dunegan corollary, which states that if acoustic emissions are observed prior to a previous maximum load, some type of new damage must have occurred. (Note: Time dependent processes like corrosion and hydrogen embrittlement tend to render the Kaiser Effect useless)
Noise
The sensitivity of an acoustic emission system is often limited by the amount of background noise nearby. Noise in AE testing refers to any undesirable signals detected by the sensors. Examples of these signals include frictional sources (e.g. loose bolts or movable connectors that shift when exposed to wind loads) and impact sources (e.g. rain, flying objects or wind-driven dust) in bridges. Sources of noise may also be present in applications where the area being tested may be disturbed by mechanical vibrations (e.g. pumps).
To compensate for the effects of background noise, various procedures can be implemented. Some possible approaches involve fabricating special sensors with electronic gates for noise blocking, taking precautions to place sensors as far away as possible from noise sources, and electronic filtering (either using signal arrival times or differences in the spectral content of true AE signals and background noise).
Pseudo Sources
In addition to the AE source mechanisms described above, pseudo source mechanisms produce AE signals that are detected by AE equipment. Examples include liquefaction and solidification, friction in rotating bearings, solid-solid phase transformations, leaks, cavitation, and the realignment or growth of magnetic domains (See Barkhausen Effect).