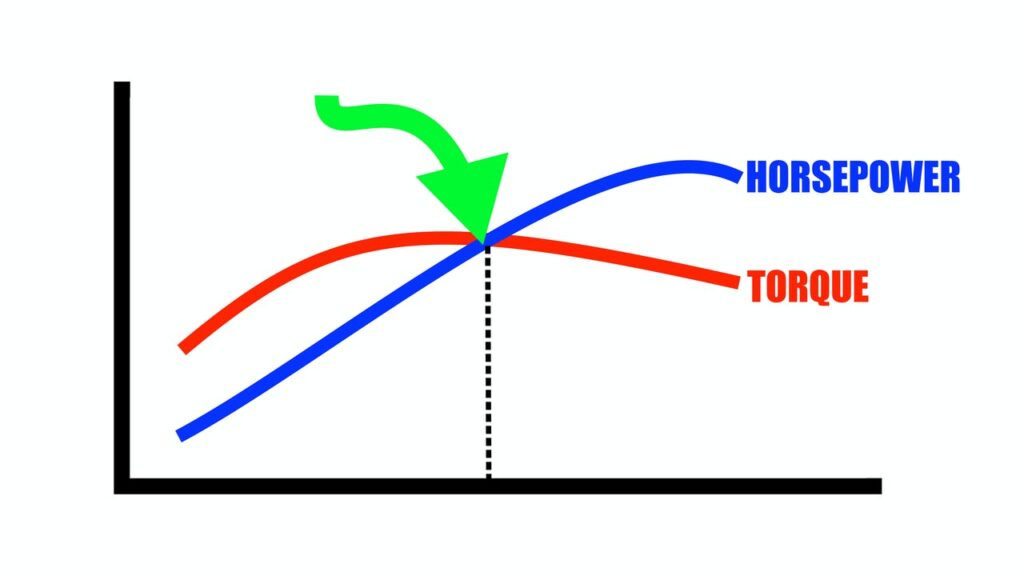
At first glance, torque-power charts seem to show that at a certain engine speed, the two curves cross. Does this really happen? Is it a magic point or just a coincidence? Do the horsepower and torque curves really cross? Can they? Let’s find out.
Introduction
In this article, I’ll try to show whether this is magic or coincidence. We’ll do this through an example, but first let’s review some of the basics concerning torque and horsepower.
Torque
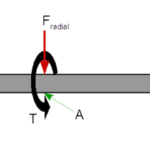
What we commonly call “pulling power” in reference to heavy towing, the torque that can be measured and defined is actually a couple of equal forces that act in opposite directions at a distance from each other that exert a twisting force that tries to turn an object such as a screw, a shaft, or a wheel. Torque is measured in force by distance units like lb-ft (pound foot) and N-m (Newton meter) measured by tools and instruments such as a torque-meter and a dynamometer.
Torque is of a work and energy nature. The role of torque in rotational movements is like the role of force in translational movements. In a rotational movement, torque is needed to come up with moments of resisting forces like friction, drag, and inertia, and in accelerating up to a desired speed, for keeping that speed. The amount of needed torque equals the sum of resisting and accelerating moments.
Power and horsepower
Power is the capability of a machine or system to do work. Power is calculated as the rate of doing work in force by distance per unit time- in units like lb-ft/min (foot pounds per minute) or N-m/s (Newton meters per second, which is also called the Watt).
Several units of measurement of power are named horsepower, names like mechanical horsepower or imperial horsepower, metric horsepower, Royal Automobile Club (RAC) horsepower, or British tax horsepower, etc. The values of these units are slightly different and vary between 735.5 to 750 watts.
In a rotational movement, power is calculated from measured torque and rpm. In an engine, power is provided by a rotating shaft which at any rpm exerts a certain amount of torque on a load.
Torque vs power
Torque-power charts show variations of power and torque at different engine speeds. Considering the information in the following table (click to enlarge), which is taken as an example of measured speed and torque, and consequently the calculated power of an engine, we can easily see the comparative results in two torque-power charts, one in which torque is in lb-ft and power in horsepower and the other in which torque is in N-m and power is in Kw.

Considering the point where the torque and power curves cross, we can see that when torque is in lb-ft and power is in horsepower, the crossing point is at a different speed (RPM) from when the torque is in N-m and power is in Kw. This leads us to the question: Do power and torque curves actually cross?
The answer is “definitely not,” because the apparent crossing point read for both curves on the vertical scales are of two different natures. Torque is of a work and energy nature and horsepower is of a power (work per unit time) nature.
So there is not anything magical about the apparent crossing point of the torque and horsepower curves, but there are still some facts that can be learned from plotting the two curves together on the same chart.


Facts that can be learned from torque-horsepower charts
The facts that can be learned from studying torque-horsepower curves include:
○ Torque and horsepower peaks do not happen at maximum RPM. Investigating for the reason has led to research projects in the past and might lead the same way in the future. All that can be said is as the engine speed increases, some negative factors become more effective and decrease generated torque and horsepower. One of these factors is that at higher engine speed intake valves do not have enough time to intake adequate air and/or fuel to increase or maintain the horsepower and torque.
○ Torque peak occurs at a considerable lower RPM than power peak. In other words the torque peak happens well below the power peak.
○ In whatever scales torque power chart is plotted, the shape of the curves remains the same and only their proportional position changes.
Relation of torque and power with RPM can be considered from different points of views including specific fuel consumption (consumed fuel per unit generated power), the importance of torque or power at different conditions of engine (start up, accelerating, keeping constant speed, and decelerating), and RPM variation band (wide bands like variation of RPM in automotive engines or narrow bands like the almost constant or limited varying RPM in aircraft). Any of the above viewpoints leads to its own specific discussions.