Pitch and Frequency
A sound wave, like any other wave, is introduced into a medium by a vibrating object. The vibrating object is the source of the disturbance that moves through the medium. The vibrating object that  creates the disturbance could be the vocal cords of a person, the vibrating string and sound board of a guitar or violin, the vibrating tines of a tuning fork, or the vibrating diaphragm of a radio speaker. Regardless of what vibrating object is creating the sound wave, the particles of the medium through which the sound moves is vibrating in a back and forth motion at a given frequency. The frequency of a wave refers to how often the particles of the medium vibrate when a wave passes through the medium. The frequency of a wave is measured as the number of complete back-and-forth vibrations of a particle of the medium per unit of time. If a particle of air undergoes 1000 longitudinal vibrations in 2 seconds, then the frequency of the wave would be 500 vibrations per second. A commonly used unit for frequency is the Hertz (abbreviated Hz), where
1 Hertz = 1 vibration/second
As a sound wave moves through a medium, each particle of the medium vibrates at the same frequency. This is sensible since each particle vibrates due to the motion of its nearest neighbor. The first particle of the medium begins vibrating, at say 500 Hz, and begins to set the second particle into vibrational motion at the same frequency of 500 Hz. The second particle begins vibrating at 500 Hz and thus sets the third particle of the medium into vibrational motion at 500 Hz. The process continues throughout the medium; each particle vibrates at the same frequency. And of course the frequency at which each particle vibrates is the same as the frequency of the original source of the sound wave. Subsequently, a guitar string vibrating at 500 Hz will set the air particles in the room vibrating at the same frequency of 500 Hz, which carries a sound signal to the ear of a listener, which is detected as a 500 Hz sound wave.
The back-and-forth vibrational motion of the particles of the medium would not be the only observable phenomenon occurring at a given frequency. Since a sound wave is a pressure wave, a detector could be used to detect oscillations in pressure from a high pressure to a low pressure and back to a high pressure. As the compressions (high pressure) and rarefactions (low pressure) move through the medium, they would reach the detector at a given frequency. For example, a compression would reach the detector 500 times per second if the frequency of the wave were 500 Hz. Similarly, a rarefaction would reach the detector 500 times per second if the frequency of the wave were 500 Hz. The frequency of a sound wave not only refers to the number of back-and-forth vibrations of the particles per unit of time, but also refers to the number of compressions or rarefactions that pass a given point per unit of time. A detector could be used to detect the frequency of these pressure oscillations over a given period of time. The typical output provided by such a detector is a pressure-time plot as shown below.

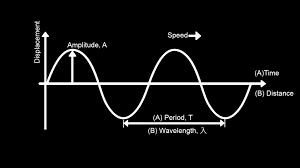
Since a pressure-time plot shows the fluctuations in pressure over time, the period of the sound wave can be found by measuring the time between successive high pressure points (corresponding to the compressions) or the time between successive low pressure points (corresponding to the rarefactions). As discussed in an earlier unit, the frequency is simply the reciprocal of the period. For this reason, a sound wave with a high frequency would correspond to a pressure time plot with a small period – that is, a plot corresponding to a small amount of time between successive high pressure points. Conversely, a sound wave with a low frequency would correspond to a pressure time plot with a large period – that is, a plot corresponding to a large amount of time between successive high pressure points. The diagram below shows two pressure-time plots, one corresponding to a high frequency and the other to a low frequency.

Frequency, Pitch and Human Perception
The ears of a human (and other animals) are sensitive detectors capable of detecting the fluctuations in air pressure that impinge upon the eardrum. The mechanics of the ear’s detection ability will be discussed later in this lesson. For now, it is sufficient to say that the human ear is capable of detecting sound waves with a wide range of frequencies, ranging between approximately 20 Hz to 20 000 Hz. Any sound with a frequency below the audible range of hearing (i.e., less than 20 Hz) is known as an infrasound and any sound with a frequency above the audible range of hearing (i.e., more than 20 000 Hz) is known as an ultrasound. Humans are not alone in their ability to detect a wide range of frequencies. Dogs can detect frequencies as low as approximately 50 Hz and as high as 45 000 Hz. Cats can detect frequencies as low as approximately 45 Hz and as high as 85 000 Hz. Bats, being nocturnal creature, must rely on sound echolocation for navigation and hunting. Bats can detect frequencies as high as 120 000 Hz. Dolphins can detect frequencies as high as 200 000 Hz. While dogs, cats, bats, and dolphins have an unusual ability to detect ultrasound, an elephant possesses the unusual ability to detect infrasound, having an audible range from approximately 5 Hz to approximately 10 000 Hz.
The sensation of a frequency is commonly referred to as the pitch of a sound. A high pitch sound corresponds to a high frequency sound wave and a low pitch sound corresponds to a low frequency sound wave. Amazingly, many people, especially those who have been musically trained, are capable of detecting a difference in frequency between two separate sounds that is as little as 2 Hz. When two sounds with a frequency difference of greater than 7 Hz are played simultaneously, most people are capable of detecting the presence of a complex wave pattern resulting from the interference and superposition of the two sound waves. Certain sound waves when played (and heard) simultaneously will produce a particularly pleasant sensation when heard, are said to be consonant. Such sound waves form the basis of intervals in music. For example, any two sounds whose frequencies make a 2:1 ratio are said to be separated by an octave and result in a particularly pleasing sensation when heard. That is, two sound waves sound good when played together if one sound has twice the frequency of the other. Similarly two sounds with a frequency ratio of 5:4 are said to be separated by an interval of a third; such sound waves also sound good when played together. Examples of other sound wave intervals and their respective frequency ratios are listed in the table below.
| Interval | Frequency Ratio | Examples |
| Octave | 2:1 | 512 Hz and 256 Hz |
| Third | 5:4 | 320 Hz and 256 Hz |
| Fourth | 4:3 | 342 Hz and 256 Hz |
| Fifth | 3:2 | 384 Hz and 256 Hz |
The ability of humans to perceive pitch is associated with the frequency of the sound wave that impinges upon the ear. Because sound waves traveling through air are longitudinal waves that produce high- and low-pressure disturbances of the particles of the air at a given frequency, the ear has an ability to detect such frequencies and associate them with the pitch of the sound. But pitch is not the only property of a sound wave detectable by the human ear. In the next part of Lesson 2, we will investigate the ability of the ear to perceive the intensity of a sound wave.
Check Your Understanding
1. Two musical notes that have a frequency ratio of 2:1 are said to be separated by an octave. A musical note that is separated by an octave from middle C (256 Hz) has a frequency of _____.
| a. 128 Hz | b. 254 Hz | c. 258 Hz |
| d. 345 Hz | e. none of these |
See Answer

Answer: A
Two notes separated by an octave have a frequency ration of 2:1. If a note is one octave below 256 Hz, then it must have one-half the frequency.


