So far in Lesson 2 you have learned the following conceptual notions about projectiles.
· A projectile is any object upon which the only force is gravity,
· Projectiles travel with a parabolic trajectory due to the influence of gravity,
· There are no horizontal forces acting upon projectiles and thus no horizontal acceleration,
· The horizontal velocity of a projectile is constant (a never changing in value),
· There is a vertical acceleration caused by gravity; its value is 9.8 m/s/s, down,
· The vertical velocity of a projectile changes by 9.8 m/s each second,
· The horizontal motion of a projectile is independent of its vertical motion.
In this portion of Lesson 2 you will learn how to describe the motion of projectiles numerically. You will learn how the numerical values of the x- and y-components of the velocity and displacement change with time (or remain constant). As you proceed through this part of Lesson 2, pay careful attention to how a conceptual understanding of projectiles translates into a numerical understanding.
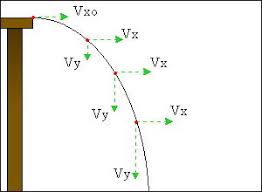
Consider again the cannonball launched by a cannon from the top of a very high cliff. Suppose that the cannonball is launched horizontally with no upward angle whatsoever and with an initial speed of 20 m/s. If there were no gravity, the cannonball would continue in motion at 20 m/s in the horizontal direction. Yet in actuality, gravity causes the cannonball to accelerate downwards at a rate of 9.8 m/s/s. This means that the vertical velocity is changing by 9.8 m/s every second. If a vector diagram (showing the velocity of the cannonball at 1-second intervals of time) is used to represent how the x- and y-components of the velocity of the cannonball is changing with time, then x- and y- velocity vectors could be drawn and their magnitudes labeled. The lengths of the vector arrows are representative of the magnitudes of that quantity. Such a diagram is shown below.

The important concept depicted in the above vector diagram is that the horizontal velocity remains constant during the course of the trajectory and the vertical velocity changes by 9.8 m/s every second. These same two concepts could be depicted by a table illustrating how the x- and y-component of the velocity vary with time.
| Time | HorizontalVelocity | VerticalVelocity |
| 0 s | 20 m/s, right | 0 |
| 1 s | 20 m/s, right | 9.8 m/s, down |
| 2 s | 20 m/s, right | 19.6 m/s, down |
| 3 s | 20 m/s, right | 29.4 m/s, down |
| 4 s | 20 m/s, right | 39.2 m/s, down |
| 5 s | 20 m/s, right | 49.0 m/s, down |
The numerical information in both the diagram and the table above illustrate identical points – a projectile has a vertical acceleration of 9.8 m/s/s, downward and no horizontal acceleration. This is to say that the vertical velocity changes by 9.8 m/s each second and the horizontal velocity never changes. This is indeed consistent with the fact that there is a vertical force acting upon a projectile but no horizontal force. A vertical force causes a vertical acceleration – in this case, an acceleration of 9.8 m/s/s.
But what if the projectile is launched upward at an angle to the horizontal? How would the horizontal and vertical velocity values change with time? How would the numerical values differ from the previously shown diagram for a horizontally launched projectile? The diagram below reveals the answers to these questions. The diagram depicts an object launched upward with a velocity of 75.7 m/s at an angle of 15 degrees above the horizontal. For such an initial velocity, the object would initially be moving 19.6 m/s, upward and 73.1 m/s, rightward. These values are x- and y-components of the initial velocity and will be discussed in more detail in the next part of this lesson.

Again, the important concept depicted in the above diagram is that the horizontal velocity remains constant during the course of the trajectory and the vertical velocity changes by 9.8 m/s every second. These same two concepts could be depicted by a table illustrating how the x- and y-component of the velocity vary with time.
Time | HorizontalVelocity | VerticalVelocity |
| 0 s | 73.1 m/s, right | 19.6 m/s, up |
| 1 s | 73.1 m/s, right | 9.8 m/s, up |
| 2 s | 73.1 m/s, right | 0 m/s |
| 3 s | 73.1 m/s, right | 9.8 m/s, down |
| 4 s | 73.1 m/s, right | 19.6 m/s, down |
| 5 s | 73.1 m/s, right | 29.4 m/s, down |
| 6 s | 73.1 m/s, right | 39.2 m/s, down |
| 7 s | 73.1 m/s, right | 49.0 m/s, down |
The numerical information in both the diagram and the table above further illustrate the two key principles of projectile motion – there is a horizontal velocity that is constant and a vertical velocity that changes by 9.8 m/s each second. As the projectile rises towards its peak, it is slowing down (19.6 m/s to 9.8 m/s to 0 m/s); and as it falls from its peak, it is speeding up (0 m/s to 9.8 m/s to 19.6 m/s to …). Finally, the symmetrical nature of the projectile’s motion can be seen in the diagram above: the vertical speed one second before reaching its peak is the same as the vertical speed one second after falling from its peak. The vertical speed two seconds before reaching its peak is the same as the vertical speed two seconds after falling from its peak. For non-horizontally launched projectiles, the direction of the velocity vector is sometimes considered + on the way up and – on the way down; yet the magnitude of the vertical velocity (i.e., vertical speed) is the same an equal interval of time on either side of its peak. At the peak itself, the vertical velocity is 0 m/s; the velocity vector is entirely horizontal at this point in the trajectory. These concepts are further illustrated by the diagram below for a non-horizontally launched projectile that lands at the same height as which it is launched.

The above diagrams, tables, and discussion pertain to how the horizontal and vertical components of the velocity vector change with time during the course of projectile’s trajectory. Another vector quantity that can be discussed is the displacement. The numerical description of the displacement of a projectile is discussed in the next section of Lesson 2.


