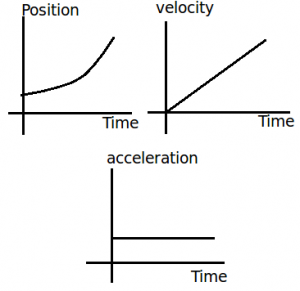
Sometimes an accelerating object will change its velocity by the same amount each second. As mentioned in the previous paragraph, the data table above show an object changing its velocity by 10 m/s in each consecutive second. This is referred to as a constant acceleration since the velocity is changing by a constant amount each second. An object with a constant acceleration should not be confused with an object with a constant velocity. Don’t be fooled! If an object is changing its velocity -whether by a constant amount or a varying amount – then it is an accelerating object. And an object with a constant velocity is not accelerating. The data tables below depict motions of objects with a constant acceleration and a changing acceleration. Note that each object has a changing velocity.

Since accelerating objects are constantly changing their velocity, one can say that the distance traveled/time is not a constant value. A falling object for instance usually accelerates as it falls. If we were to observe the motion of a free-falling object (free fall motion will be discussed in detail later), we would observe that the object averages a velocity of approximately 5 m/s in the first second, approximately 15 m/s in the second second, approximately 25 m/s in the third second, approximately 35 m/s in the fourth second, etc. Our free-falling object would be constantly accelerating. Given these average velocity values during each consecutive 1-second time interval, we could say that the object would fall 5 meters in the first second, 15 meters in the second second (for a total distance of 20 meters), 25 meters in the third second (for a total distance of 45 meters), 35 meters in the fourth second (for a total distance of 80 meters after four seconds). These numbers are summarized in the table below.
| Time Interval | Velocity Change During Interval | Ave. Velocity During Interval | Distance Traveled During Interval | Total Distance Traveled from 0 s to End of Interval |
| 0 – 1.0 s | 0 to ~10 m/s | ~5 m/s | ~5 m | ~5 m |
| 1.0 – 2.0 s | ~10 to 20 m/s | ~15 m/s | ~15 m | ~20 m |
| 2.0 – 3.0 s | ~20 to 30 m/s | ~25 m/s | ~25 m | ~45 m |
| 3.0 – 4.0 s | ~30 to 40 m/s | ~35 m/s | ~35 m | ~80 m |
Note: The ~ symbol as used here means approximately.
This discussion illustrates that a free-falling object that is accelerating at a constant rate will cover different distances in each consecutive second. Further analysis of the first and last columns of the data above reveal that there is a square relationship between the total distance traveled and the time of travel for an object starting from rest and moving with a constant acceleration. The total distance traveled is directly proportional to the square of the time. As such, if an object travels for twice the time, it will cover four times (2^2) the distance; the total distance traveled after two seconds is four times the total distance traveled after one second. If an object travels for three times the time, then it will cover nine times (3^2) the distance; the distance traveled after three seconds is nine times the distance traveled after one second. Finally, if an object travels for four times the time, then it will cover 16 times (4^2) the distance; the distance traveled after four seconds is 16 times the distance traveled after one second. For objects with a constant acceleration, the distance of travel is directly proportional to the square of the time of travel.


