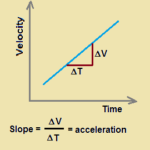
As learned in an earlier part of this lesson, a plot of velocity-time can be used to determine the acceleration of an object (the slope). In this part of the lesson, we will learn how a plot of velocity versus time can also be used to determine the displacement of an object. For velocity versus time graphs, the area bound by the line and the axes represents the displacement. The diagram below shows three different velocity-time graphs; the shaded regions between the line and the time-axis represent the displacement during the stated time interval.
| The shaded area is representative of the displacement during from 0 seconds to 6 seconds. This area takes on the shape of a rectangle can be calculated using the appropriate equation. |  |
| The shaded area is representative of the displacement during from 0 seconds to 4 seconds. This area takes on the shape of a triangle can be calculated using the appropriate equation. |  |
| The shaded area is representative of the displacement during from 2 seconds to 5 seconds. This area takes on the shape of a trapezoidcan be calculated using the appropriate equation. |  |
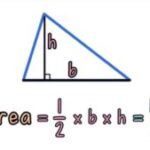
The method used to find the area under a line on a velocity-time graph depends upon whether the section bound by the line and the axes is a rectangle, a triangle or a trapezoid. Area formulas for each shape are given below.
| Rectangle | Triangle | Trapezoid |
| Area = b • h | Area = ½ • b • h | Area = ½ • b • (h1 + h2) |
Calculating the Area of a Rectangle
Now we will look at a few example computations of the area for each of the above geometric shapes. First consider the calculation of the area for a few rectangles. The solution for finding the area is shown for the first example below. The shaded rectangle on the velocity-time graph has a base of 6 s and a height of 30 m/s. Since the area of a rectangle is found by using the formula A = b x h, the area is 180 m (6 s x 30 m/s). That is, the object was displaced 180 meters during the first 6 seconds of motion.
 | Area = b * h Area = (6 s) * (30 m/s) Area = 180 m |
![]() Now try the following two practice problems as a check of your understanding. Determine the displacement (i.e., the area) of the object during the first 4 seconds (Practice A) and from 3 to 6 seconds (Practice B).
Now try the following two practice problems as a check of your understanding. Determine the displacement (i.e., the area) of the object during the first 4 seconds (Practice A) and from 3 to 6 seconds (Practice B).
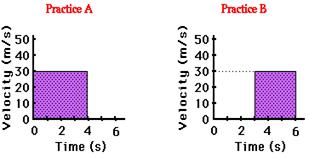

The area of a rectangle is determined by multiplying the base by the height.
A = b • h where b = 4 s and h = 30 m/s.
A = (4 s) • (30 m/s) = 120 m
That is, the object was displaced 120 m during the first 4 seconds of motion.
The area of a rectangle is determined by multiplying the base by the height.
A = b • h where b = 3 s and h = 30 m/s.
A = (3 s) • (30 m/s) = 90 m
That is, the object was displaced 90 m during the interval of time between 3 and 6 seconds.