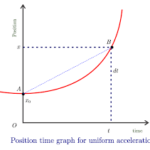
As a final application of this principle of slope, consider the two graphs below. Both graphs show plotted points forming a curved line. Curved lines have changing slope; they may start with a very small slope and begin curving sharply (either upwards or downwards) towards a large slope. In either case, the curved line of changing slope is a sign of accelerated motion (i.e., changing velocity). Applying the principle of slope to the graph on the left, one would conclude that the object depicted by the graph is moving with a negative velocity (since the slope is negative ). Furthermore, the object is starting with a small velocity (the slope starts out with a small slope) and finishes with a large velocity (the slope becomes large). That would mean that this object is moving in the negative direction and speeding up (the small velocity turns into a larger velocity). This is an example of negative acceleration – moving in the negative direction and speeding up. The graph on the right also depicts an object with negative velocity (since there is a negative slope). The object begins with a high velocity (the slope is initially large) and finishes with a small velocity (since the slope becomes smaller). So this object is moving in the negative direction and slowing down. This is an example of positive acceleration.
| Negative (-) Velocity Slow to Fast | Leftward (-) Velocity Fast to Slow |
 |  |
The principle of slope is an incredibly useful principle for extracting relevant information about the motion of objects as described by their position vs. time graph. Once you’ve practiced the principle a few times, it becomes a very natural means of analyzing position-time graphs.


