It was learned earlier in Lesson 3 that the slope of the line on a position versus time graph is equal to the velocity of the object. If the object is moving with a velocity of +4 m/s, then the slope of the line will be +4 m/s. If the object is moving with a velocity of -8 m/s, then the slope of the line will be -8 m/s. If the object has a velocity of 0 m/s, then the slope of the line will be 0 m/s. The slope of the line on a position versus time graph tells it all. Because of its importance, a student of physics must have a good understanding of how to calculate the slope of a line. In this part of the lesson, the method for determining the slope of a line on a position-time graph will be discussed.
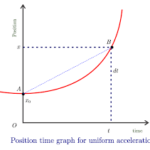
Let’s begin by considering the position versus time graph below.
The line is sloping upwards to the right. But mathematically, by how much does it slope upwards for every 1 second along the horizontal (time) axis? To answer this question we must use the slope equation.