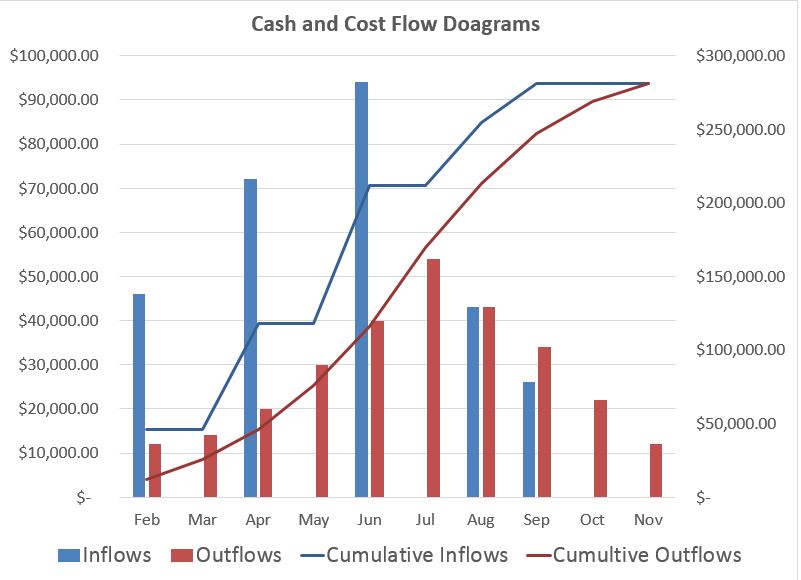
It is difficult to solve a problem if you cannot see it. The easiest way to approach problems in economic analysis is to draw a picture. The picture should show three things:
1. A time interval divided into an appropriate number of equal periods
2. All cash outflows (deposits, expenditures, etc.) in each period
3. All cash inflows (withdrawals, income, etc.) for each period
Unless otherwise indicated, all such cash flows are con-sidered to occur at the end of their respective periods.
Figure 5-7.1 is a cash-flow diagram showing an out-flow or disbursement of $1000 at the beginning of year 1 and an inflow or return of $2000 at the end of year 5.
Notation
To simplify the subject of economic analysis, sym-bols are introduced to represent types of cash flows and

Figure 5-7.1. Cash-flow diagram.
interest factors. The symbols used in this chapter conform to ANSI Z94;4 however, not all practitioners follow this standard convention, and care must be taken to avoid confusion when reading the literature. The following symbols will be used here:
P =Present sum of money ($)
F =Future sum of money ($)
N =Number of interest periods
i =Interest rate per period (%)
A complete list of the ANSI Z94 symbols is given in Ap-pendix A to this chapter.


